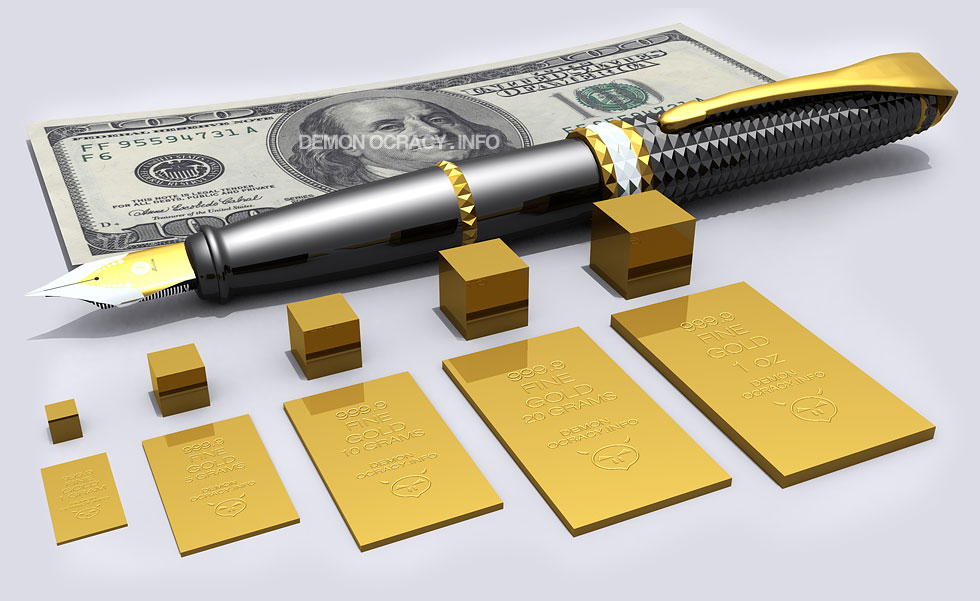
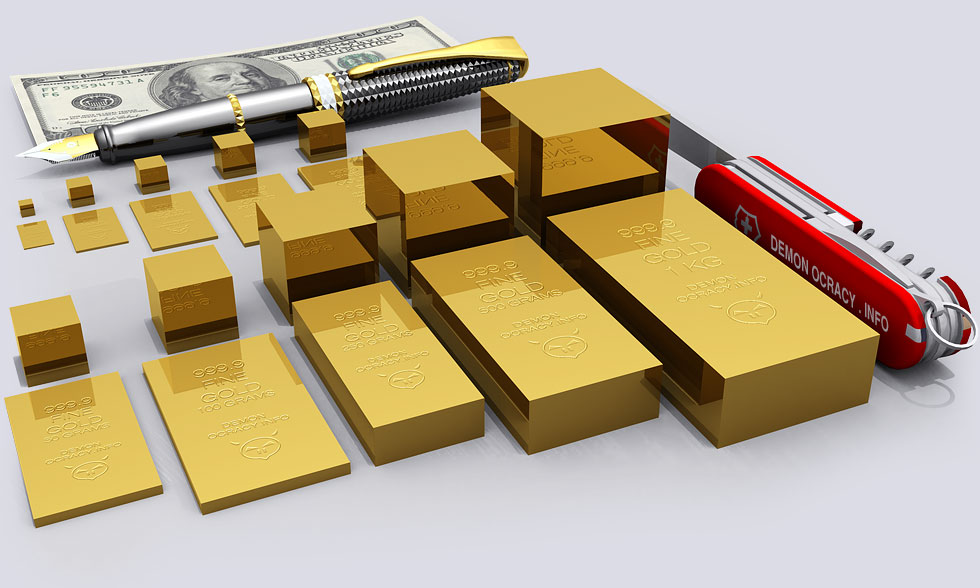
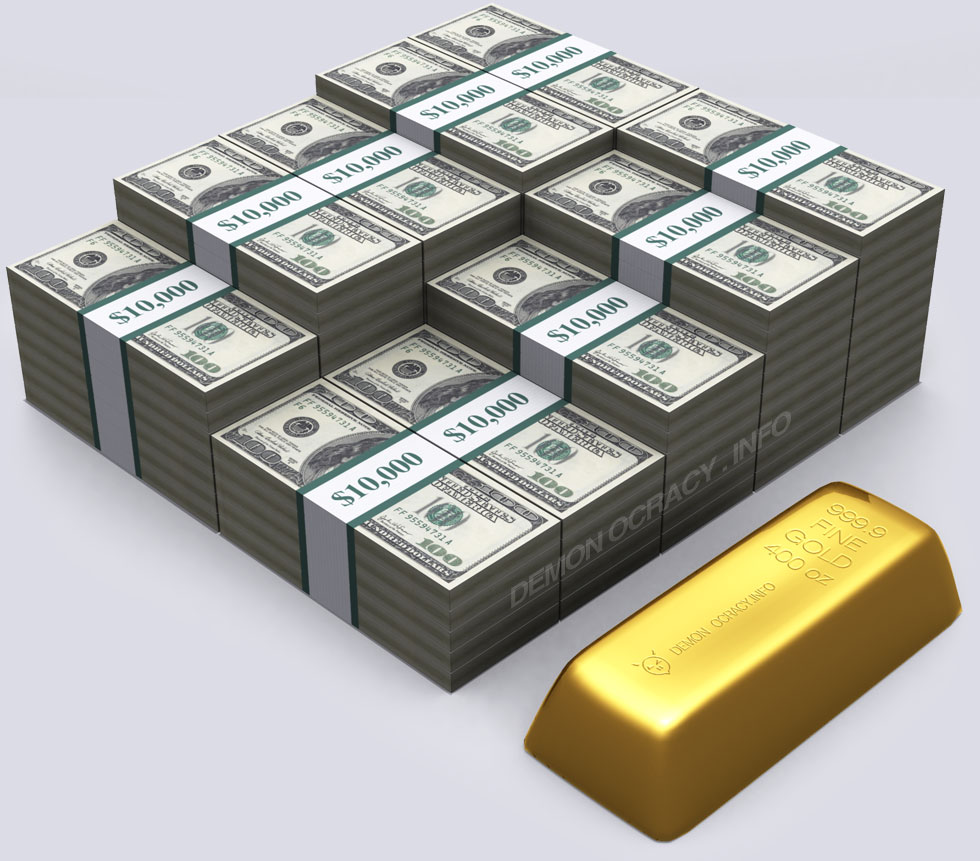
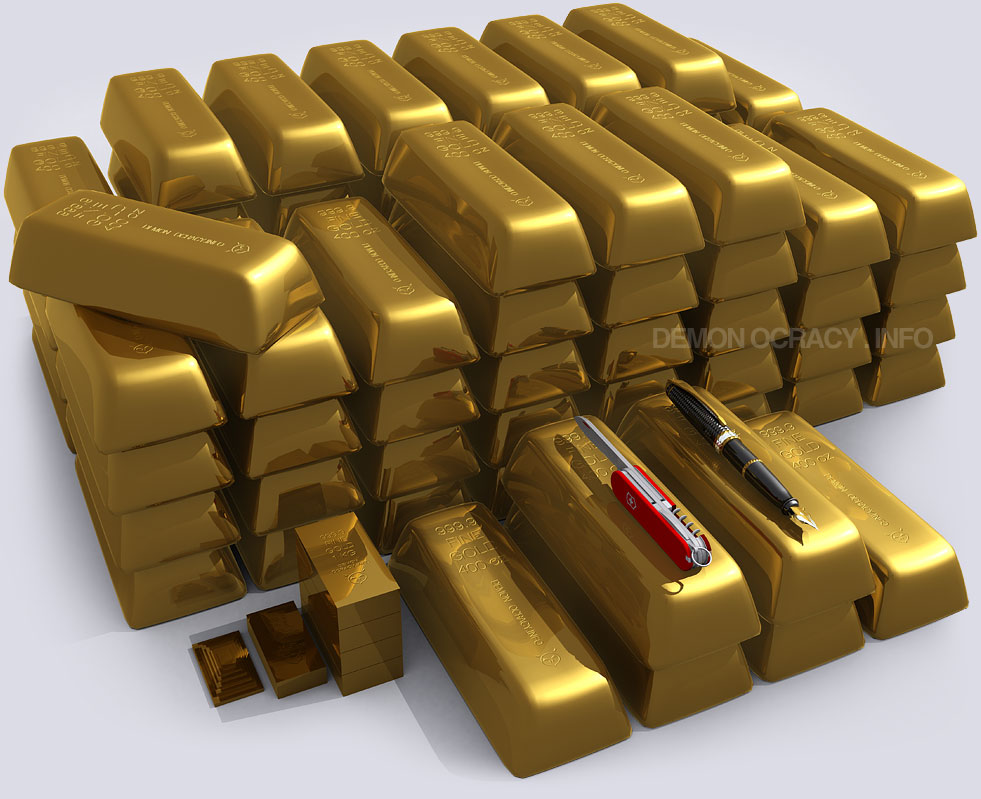
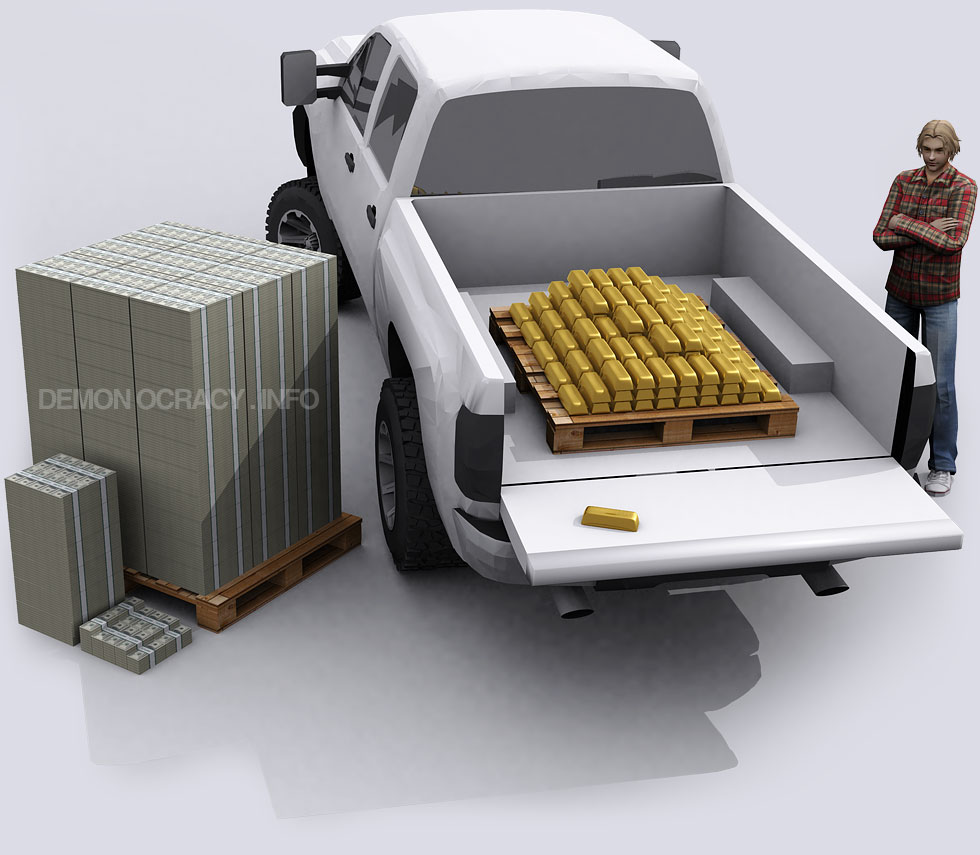
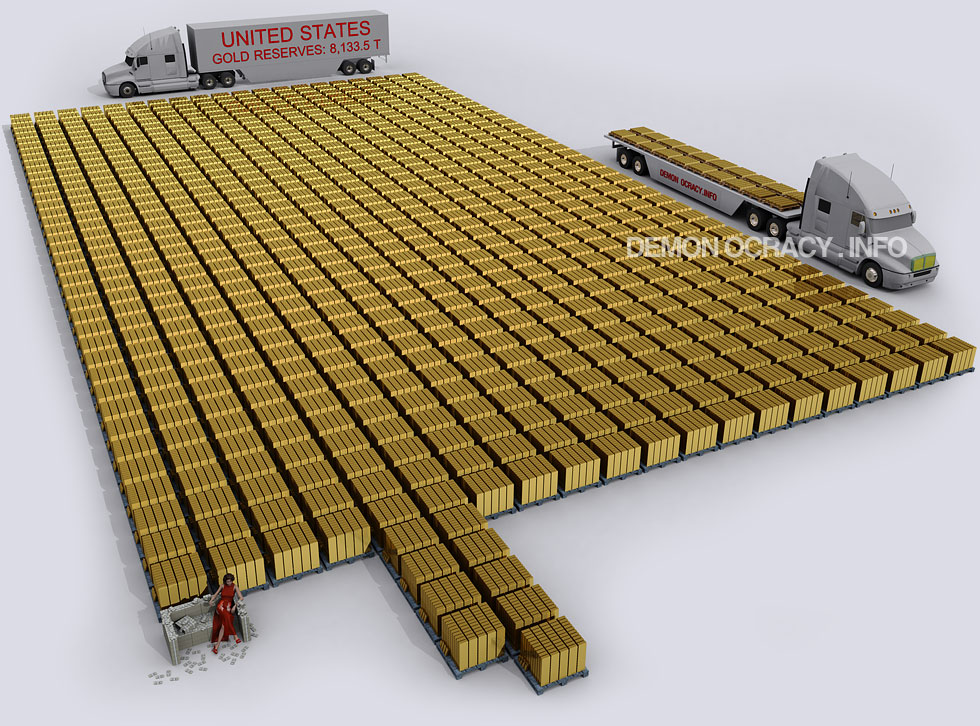
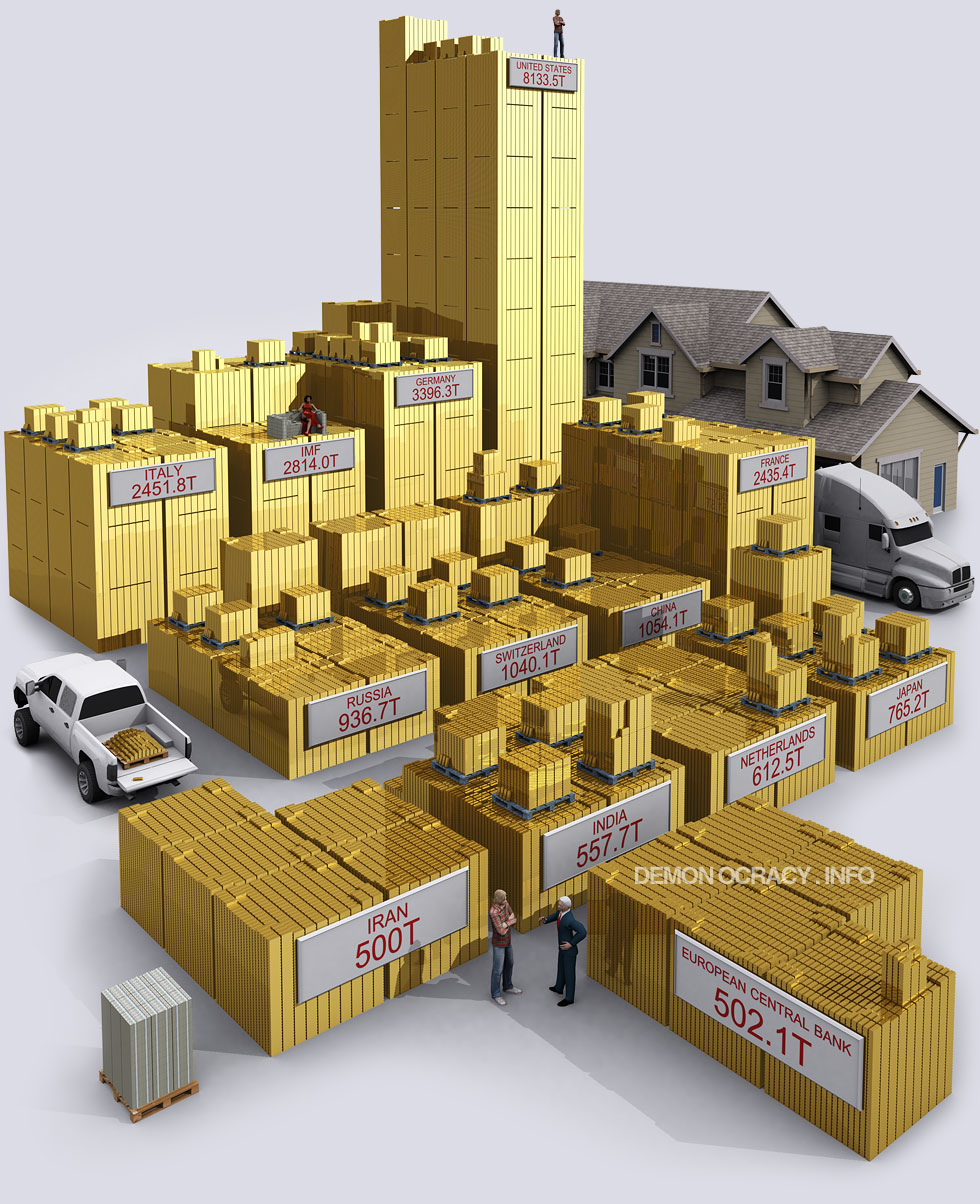
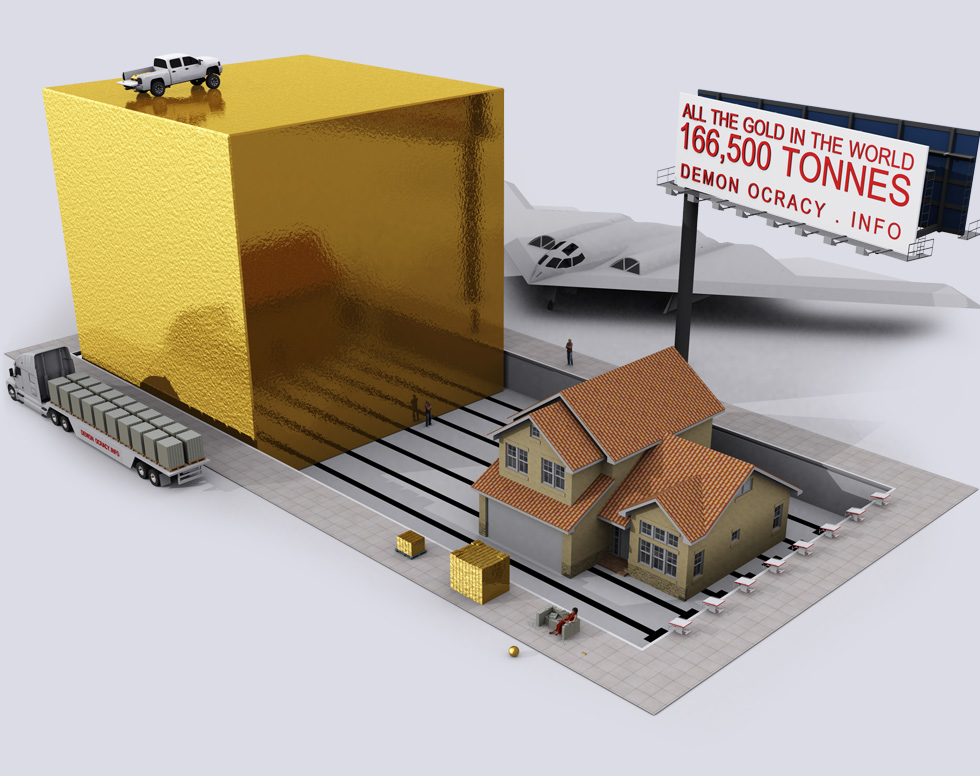
Think about that for a moment. One gram (0.035 oz) is equal to the mass of a small paper clip. This small amount of gold is usually not even in one place – it is dispersed through a tonne of rock and dirt in smaller amounts, most of the time invisible to the naked eye. For some companies that have the stars align with easy metallurgy, a deposit near surface, and open pit potential, this gram per tonne deposit may even somehow be economic. It’s hard to believe that such a small amount of gold could be worth so much, and that is why great visualizations can help us understand the rarity of this yellow metal. Luckily, the folks at Demonocracy.info have done the heavy lifting for us, putting together a series of 3D visualizations of gold bullion bars showcasing the world’s gold that has been mined thus far. Note: these visualizations are a couple of years old and optimistically have the value of gold pegged at US$2,000 per oz, presumably for the ease of calculations. For those interested, we have also put together a similar slideshow on the topic, showing how much gold, silver, copper, and other metals are mined each year. Smaller denominations of gold plates: 1 gram, 5 grams, 10 grams, 20 grams, and 1 troy oz of gold. Larger denominations of gold plates: 50 grams, 100 grams, 250 grams, 500 grams, and 1 kg of gold. This 400 oz gold bar, at $2,000 per oz gold, is worth the $800,000 cash beside it. The gold bar is extremely heavy, weighing more than three full milk jugs. Here’s what one tonne of gold looks like. At $2,000 per oz, it’s worth $64.3 million. Gold is so heavy that the suspension of an average truck would break if it held anymore than pictured above. Even if the truck’s suspension broke, the load of gold in the back could buy 2,660 brand new trucks at an MSRP of $40,000 per truck. Here’s 10 tonnes of gold compared to 100 tonnes of the yellow metal. This semi-truck is carrying the maximum load it can legally carry, which is about about 25 tonnes. Here there are 24.88 tonnes of gold, worth $1.6 billion. The Northrop Grumman B2 Spirit Bomber program cost $44.75 Billion for a total of 21 units built, which averages to $2,130,952,380 per unit. Shown here is the amount of gold it costs to buy one unit. Here’s the entire gold reserves of the United States government, which is 8,133.5 tonnes. Here’s the world’s gold reserves by government circa 2012. This is slightly outdated, with China and Russia both having significant increases since then. All gold mined in history, stacked in 400 oz bars. The 166,500 tonnes here is actually divided into four levels: the bottom level is jewelry (50.5% of all gold), the 2nd level is private investment (18.7%), the third level is world governments (17.4%), and the highest level is other uses for gold such as industry (13.4%). Lastly, we finish off with an image of all of the world’s mined gold in one cube with dimensions of 20.5m. If it was all melted, it would fit within the confines of an Olympic Swimming Pool. Want to learn everything you need to know about gold in about 20 minutes? Our five-part Gold Series covers everything from its rich history, supply and geology, demand drivers, investment properties, and market trends.
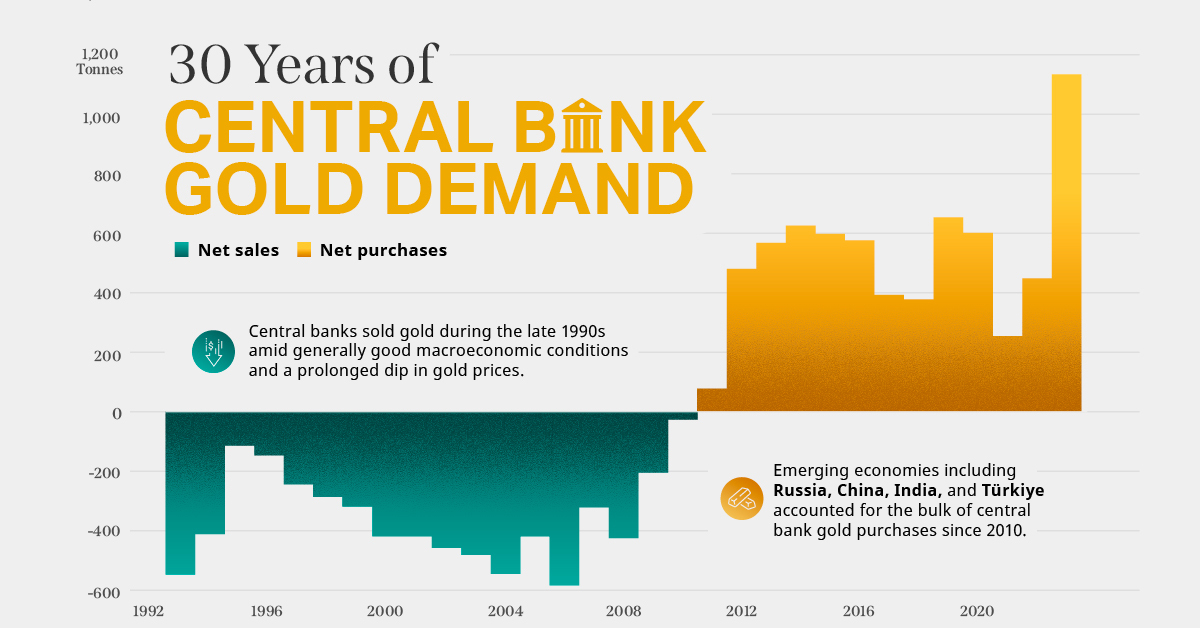
on Did you know that nearly one-fifth of all the gold ever mined is held by central banks? Besides investors and jewelry consumers, central banks are a major source of gold demand. In fact, in 2022, central banks snapped up gold at the fastest pace since 1967. However, the record gold purchases of 2022 are in stark contrast to the 1990s and early 2000s, when central banks were net sellers of gold. The above infographic uses data from the World Gold Council to show 30 years of central bank gold demand, highlighting how official attitudes toward gold have changed in the last 30 years.
Why Do Central Banks Buy Gold?
Gold plays an important role in the financial reserves of numerous nations. Here are three of the reasons why central banks hold gold:
Balancing foreign exchange reserves Central banks have long held gold as part of their reserves to manage risk from currency holdings and to promote stability during economic turmoil. Hedging against fiat currencies Gold offers a hedge against the eroding purchasing power of currencies (mainly the U.S. dollar) due to inflation. Diversifying portfolios Gold has an inverse correlation with the U.S. dollar. When the dollar falls in value, gold prices tend to rise, protecting central banks from volatility. The Switch from Selling to Buying In the 1990s and early 2000s, central banks were net sellers of gold. There were several reasons behind the selling, including good macroeconomic conditions and a downward trend in gold prices. Due to strong economic growth, gold’s safe-haven properties were less valuable, and low returns made it unattractive as an investment. Central bank attitudes toward gold started changing following the 1997 Asian financial crisis and then later, the 2007–08 financial crisis. Since 2010, central banks have been net buyers of gold on an annual basis. Here’s a look at the 10 largest official buyers of gold from the end of 1999 to end of 2021: Rank CountryAmount of Gold Bought (tonnes)% of All Buying #1🇷🇺 Russia 1,88828% #2🇨🇳 China 1,55223% #3🇹🇷 Türkiye 5418% #4🇮🇳 India 3956% #5🇰🇿 Kazakhstan 3455% #6🇺🇿 Uzbekistan 3115% #7🇸🇦 Saudi Arabia 1803% #8🇹🇭 Thailand 1682% #9🇵🇱 Poland1282% #10🇲🇽 Mexico 1152% Total5,62384% Source: IMF The top 10 official buyers of gold between end-1999 and end-2021 represent 84% of all the gold bought by central banks during this period. Russia and China—arguably the United States’ top geopolitical rivals—have been the largest gold buyers over the last two decades. Russia, in particular, accelerated its gold purchases after being hit by Western sanctions following its annexation of Crimea in 2014. Interestingly, the majority of nations on the above list are emerging economies. These countries have likely been stockpiling gold to hedge against financial and geopolitical risks affecting currencies, primarily the U.S. dollar. Meanwhile, European nations including Switzerland, France, Netherlands, and the UK were the largest sellers of gold between 1999 and 2021, under the Central Bank Gold Agreement (CBGA) framework. Which Central Banks Bought Gold in 2022? In 2022, central banks bought a record 1,136 tonnes of gold, worth around $70 billion. Country2022 Gold Purchases (tonnes)% of Total 🇹🇷 Türkiye14813% 🇨🇳 China 625% 🇪🇬 Egypt 474% 🇶🇦 Qatar333% 🇮🇶 Iraq 343% 🇮🇳 India 333% 🇦🇪 UAE 252% 🇰🇬 Kyrgyzstan 61% 🇹🇯 Tajikistan 40.4% 🇪🇨 Ecuador 30.3% 🌍 Unreported 74165% Total1,136100% Türkiye, experiencing 86% year-over-year inflation as of October 2022, was the largest buyer, adding 148 tonnes to its reserves. China continued its gold-buying spree with 62 tonnes added in the months of November and December, amid rising geopolitical tensions with the United States. Overall, emerging markets continued the trend that started in the 2000s, accounting for the bulk of gold purchases. Meanwhile, a significant two-thirds, or 741 tonnes of official gold purchases were unreported in 2022. According to analysts, unreported gold purchases are likely to have come from countries like China and Russia, who are looking to de-dollarize global trade to circumvent Western sanctions.
There were several reasons behind the selling, including good macroeconomic conditions and a downward trend in gold prices. Due to strong economic growth, gold’s safe-haven properties were less valuable, and low returns made it unattractive as an investment.
Central bank attitudes toward gold started changing following the 1997 Asian financial crisis and then later, the 2007–08 financial crisis. Since 2010, central banks have been net buyers of gold on an annual basis.
Here’s a look at the 10 largest official buyers of gold from the end of 1999 to end of 2021:
Source: IMF
The top 10 official buyers of gold between end-1999 and end-2021 represent 84% of all the gold bought by central banks during this period.
Russia and China—arguably the United States’ top geopolitical rivals—have been the largest gold buyers over the last two decades. Russia, in particular, accelerated its gold purchases after being hit by Western sanctions following its annexation of Crimea in 2014.
Interestingly, the majority of nations on the above list are emerging economies. These countries have likely been stockpiling gold to hedge against financial and geopolitical risks affecting currencies, primarily the U.S. dollar.
Meanwhile, European nations including Switzerland, France, Netherlands, and the UK were the largest sellers of gold between 1999 and 2021, under the Central Bank Gold Agreement (CBGA) framework.
Which Central Banks Bought Gold in 2022?
In 2022, central banks bought a record 1,136 tonnes of gold, worth around $70 billion. Türkiye, experiencing 86% year-over-year inflation as of October 2022, was the largest buyer, adding 148 tonnes to its reserves. China continued its gold-buying spree with 62 tonnes added in the months of November and December, amid rising geopolitical tensions with the United States. Overall, emerging markets continued the trend that started in the 2000s, accounting for the bulk of gold purchases. Meanwhile, a significant two-thirds, or 741 tonnes of official gold purchases were unreported in 2022. According to analysts, unreported gold purchases are likely to have come from countries like China and Russia, who are looking to de-dollarize global trade to circumvent Western sanctions.