Every year, the United States Geological Service (USGS) publishes commodity summaries outlining global mining statistics for over 90 individual minerals and materials. Today’s infographic visualizes the data to reveal the dramatic scale of 2019 non-fuel mineral production. Read all the way to the bottom; the data will surprise you.
Non-Fuel Minerals: USGS Methodology
A wide variety of minerals can be classified as “non-fuel”, including precious metals, base metals, industrial minerals, and materials used for construction. Non-fuel minerals are those not used for fuel, such as oil, natural gas and coal. Once non-fuel minerals are used up, there is no replacing them. However, many can be recycled continuously. The USGS tracked both refinery and mine production of these various minerals. This means that some minerals are the essential ingredients for others on the list. For example, iron ore is critical for steel production, and bauxite ore gets refined into aluminum.
Top 10 Minerals and Metals by Production
Sand and gravel are at the top of the list of non-fuel mineral production. As these materials are the basic components for the manufacturing of concrete, roads, and buildings, it’s not surprising they take the lead. These materials fertilize the food we eat, and they also form the structures we live in and the roads we drive on. They are the bones of the global economy. Let’s dive into some more specific categories covered on the infographic.
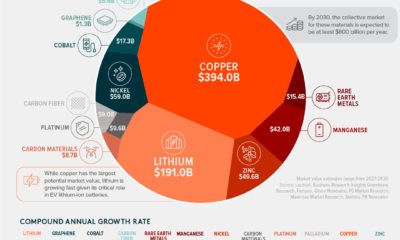
Base Metals
While cement, sand, and gravel may be the bones of global infrastructure, base metals are its lifeblood. Their consumption is an important indicator of the overall health of an economy. Base metals are non-ferrous, meaning they contain no iron. They are often more abundant in nature and sometimes easier to mine, so their prices are generally lower than precious metals. Base metals are also the critical materials that will help to deliver a green and renewable future. The electrification of everything will require vast amounts of base metals to make everything from batteries to solar cells work.
Precious Metals
Gold and precious metals grab the headlines because of their rarity — and their production shows just how rare they are. While metals form the structure and veins of the global economy, ultimately it is humans and animals that make the flesh of the world, driving consumption patterns.
A Material World: A Perspective on Scale
The global economy’s appetite for materials has quadrupled since 1970, faster than the population, which only doubled. On average, each human uses more than 13 metric tons of materials per year. In 2017, it’s estimated that humans consumed 100.6B metric tons of material in total. Half of the total comprises sand, clay, gravel, and cement used for building, along with the other minerals mined to produce fertilizer. Coal, oil, and gas make up 15% of the total, while metal makes up 10%. The final quarter are plants and trees used for food and fuel. on Both figures surpassed analyst expectations by a wide margin, and in January, the unemployment rate hit a 53-year low of 3.4%. With the recent release of February’s numbers, unemployment is now reported at a slightly higher 3.6%. A low unemployment rate is a classic sign of a strong economy. However, as this visualization shows, unemployment often reaches a cyclical low point right before a recession materializes.
Reasons for the Trend
In an interview regarding the January jobs data, U.S. Treasury Secretary Janet Yellen made a bold statement: While there’s nothing wrong with this assessment, the trend we’ve highlighted suggests that Yellen may need to backtrack in the near future. So why do recessions tend to begin after unemployment bottoms out?
The Economic Cycle
The economic cycle refers to the economy’s natural tendency to fluctuate between periods of growth and recession. This can be thought of similarly to the four seasons in a year. An economy expands (spring), reaches a peak (summer), begins to contract (fall), then hits a trough (winter). With this in mind, it’s reasonable to assume that a cyclical low in the unemployment rate (peak employment) is simply a sign that the economy has reached a high point.
Monetary Policy
During periods of low unemployment, employers may have a harder time finding workers. This forces them to offer higher wages, which can contribute to inflation. For context, consider the labor shortage that emerged following the COVID-19 pandemic. We can see that U.S. wage growth (represented by a three-month moving average) has climbed substantially, and has held above 6% since March 2022. The Federal Reserve, whose mandate is to ensure price stability, will take measures to prevent inflation from climbing too far. In practice, this involves raising interest rates, which makes borrowing more expensive and dampens economic activity. Companies are less likely to expand, reducing investment and cutting jobs. Consumers, on the other hand, reduce the amount of large purchases they make. Because of these reactions, some believe that aggressive rate hikes by the Fed can either cause a recession, or make them worse. This is supported by recent research, which found that since 1950, central banks have been unable to slow inflation without a recession occurring shortly after.
Politicians Clash With Economists
The Fed has raised interest rates at an unprecedented pace since March 2022 to combat high inflation. More recently, Fed Chairman Jerome Powell warned that interest rates could be raised even higher than originally expected if inflation continues above target. Senator Elizabeth Warren expressed concern that this would cost Americans their jobs, and ultimately, cause a recession. Powell remains committed to bringing down inflation, but with the recent failures of Silicon Valley Bank and Signature Bank, some analysts believe there could be a pause coming in interest rate hikes. Editor’s note: just after publication of this article, it was confirmed that U.S. interest rates were hiked by 25 basis points (bps) by the Federal Reserve.