In total, that would be about 7,600 dots – representing today’s global population of 7.6 billion. But, what if we went back in time, and watched those dots accumulate over human history? When and where do the first dots appear, and when does population growth ramp up to get to the billions of people that are alive today?
The History of Population Growth
Today’s animation comes from the American Museum of Natural History, and it shows over 200,000 years of population growth and the major events along the way. If you consider yourself on the more impatient side of things, we suggest starting at 1:50 which will zoom you to 400 AD – the time of India’s Golden Age. Alternatively, go to 3:25 to witness the Bubonic Plague’s rare negative impact on population growth, as well as the ensuing age of European exploration.
It took 200,000 years of human history to get to one billion people – and just 200 years to reach seven billion. That’s partly how the exponential “hockey stick” growth curve works, but it is also a factor of improvements in living standards, sanitation, and medicine that came after the Industrial Revolution.
Key Population Moments
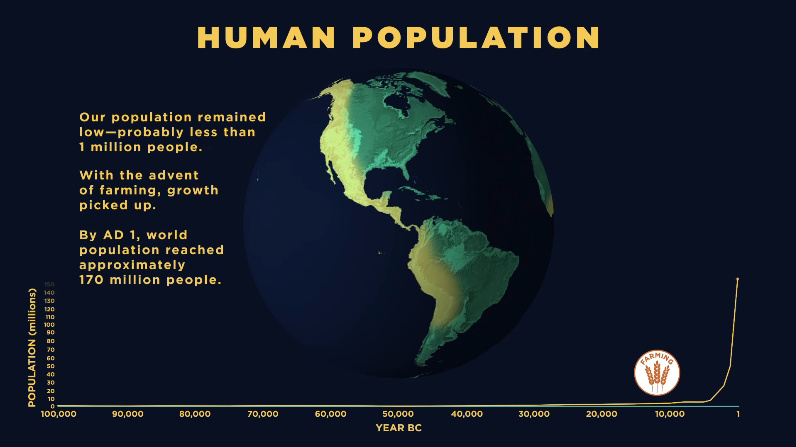
Here are a few moments that stood out to us in the video, that we think represent particularly interesting moments in human population history: Agriculture The impact of farming cannot be emphasized enough. For many thousands of years, the human population dwindled until we learned how to plant crops to provide a scalable and sustainable food supply for a hungry population.
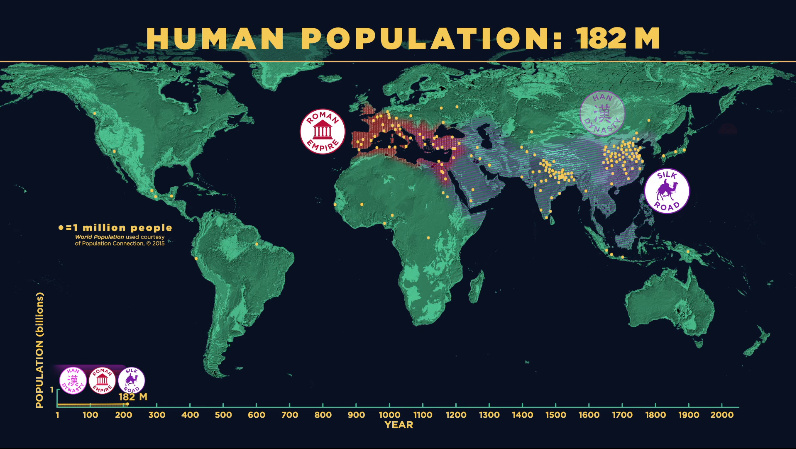
As you can see, after agriculture starts spreading, the human population quickly skyrockets. It is estimated to have reached roughly 170 million by the year 1 AD. East vs. West The Greeks and Romans were interesting cultures to us in many ways – but one thing that is sometimes missed with a Western education is the sheer size of Indian and Chinese civilizations.
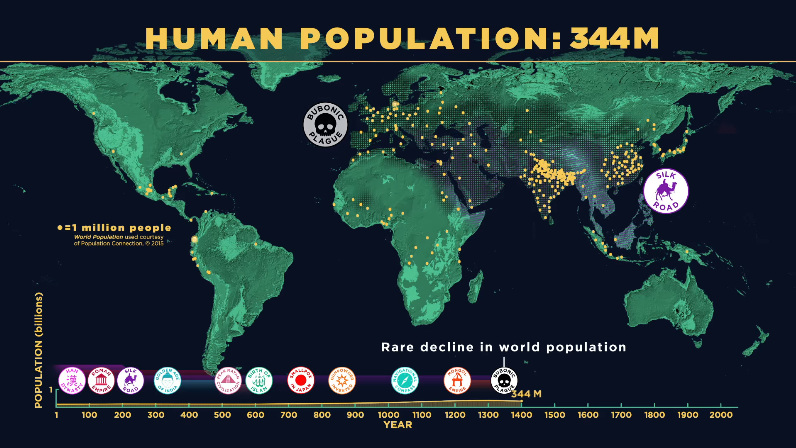
The above screenshot is from close to the territorial peak of the Roman Empire – notice its size in comparison to the Han Dynasty in China, as well as the area that is modern-day India. Bubonic Plague The Black Death, which started in 1347, didn’t do much to increase Europe’s population.
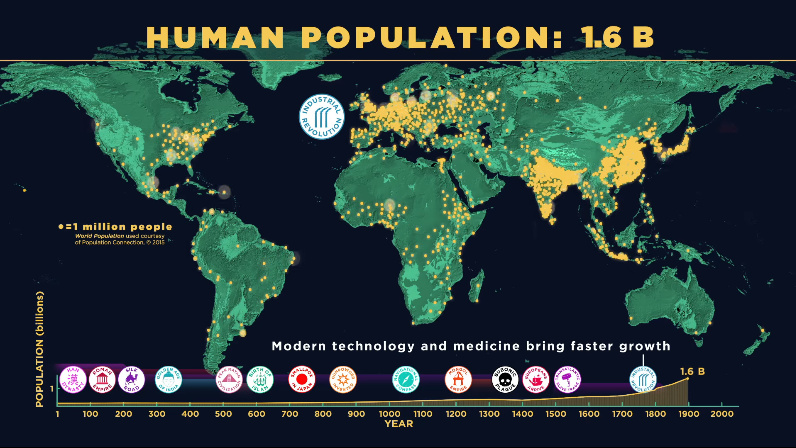
In fact, this was one of the rare times that global human population growth went backwards for multiple decades. Post-Industrial Revolution The Industrial Revolution brought innovations to food and medicine, and kickstarted an era that would be usher in the birth of many new technologies. This screenshot is from close to 1900, when these innovations started to make rapid global population growth a reality.
Over the next century, the population would more than quadruple to today’s seven billion plus people.
The Future of Population Growth
Naturally, this leads to thinking about the future of the human population. For that, we recommend visiting these two prior animations: The 20 Most Populous Megacities in 2100 and The World’s Population by Region in 2100.
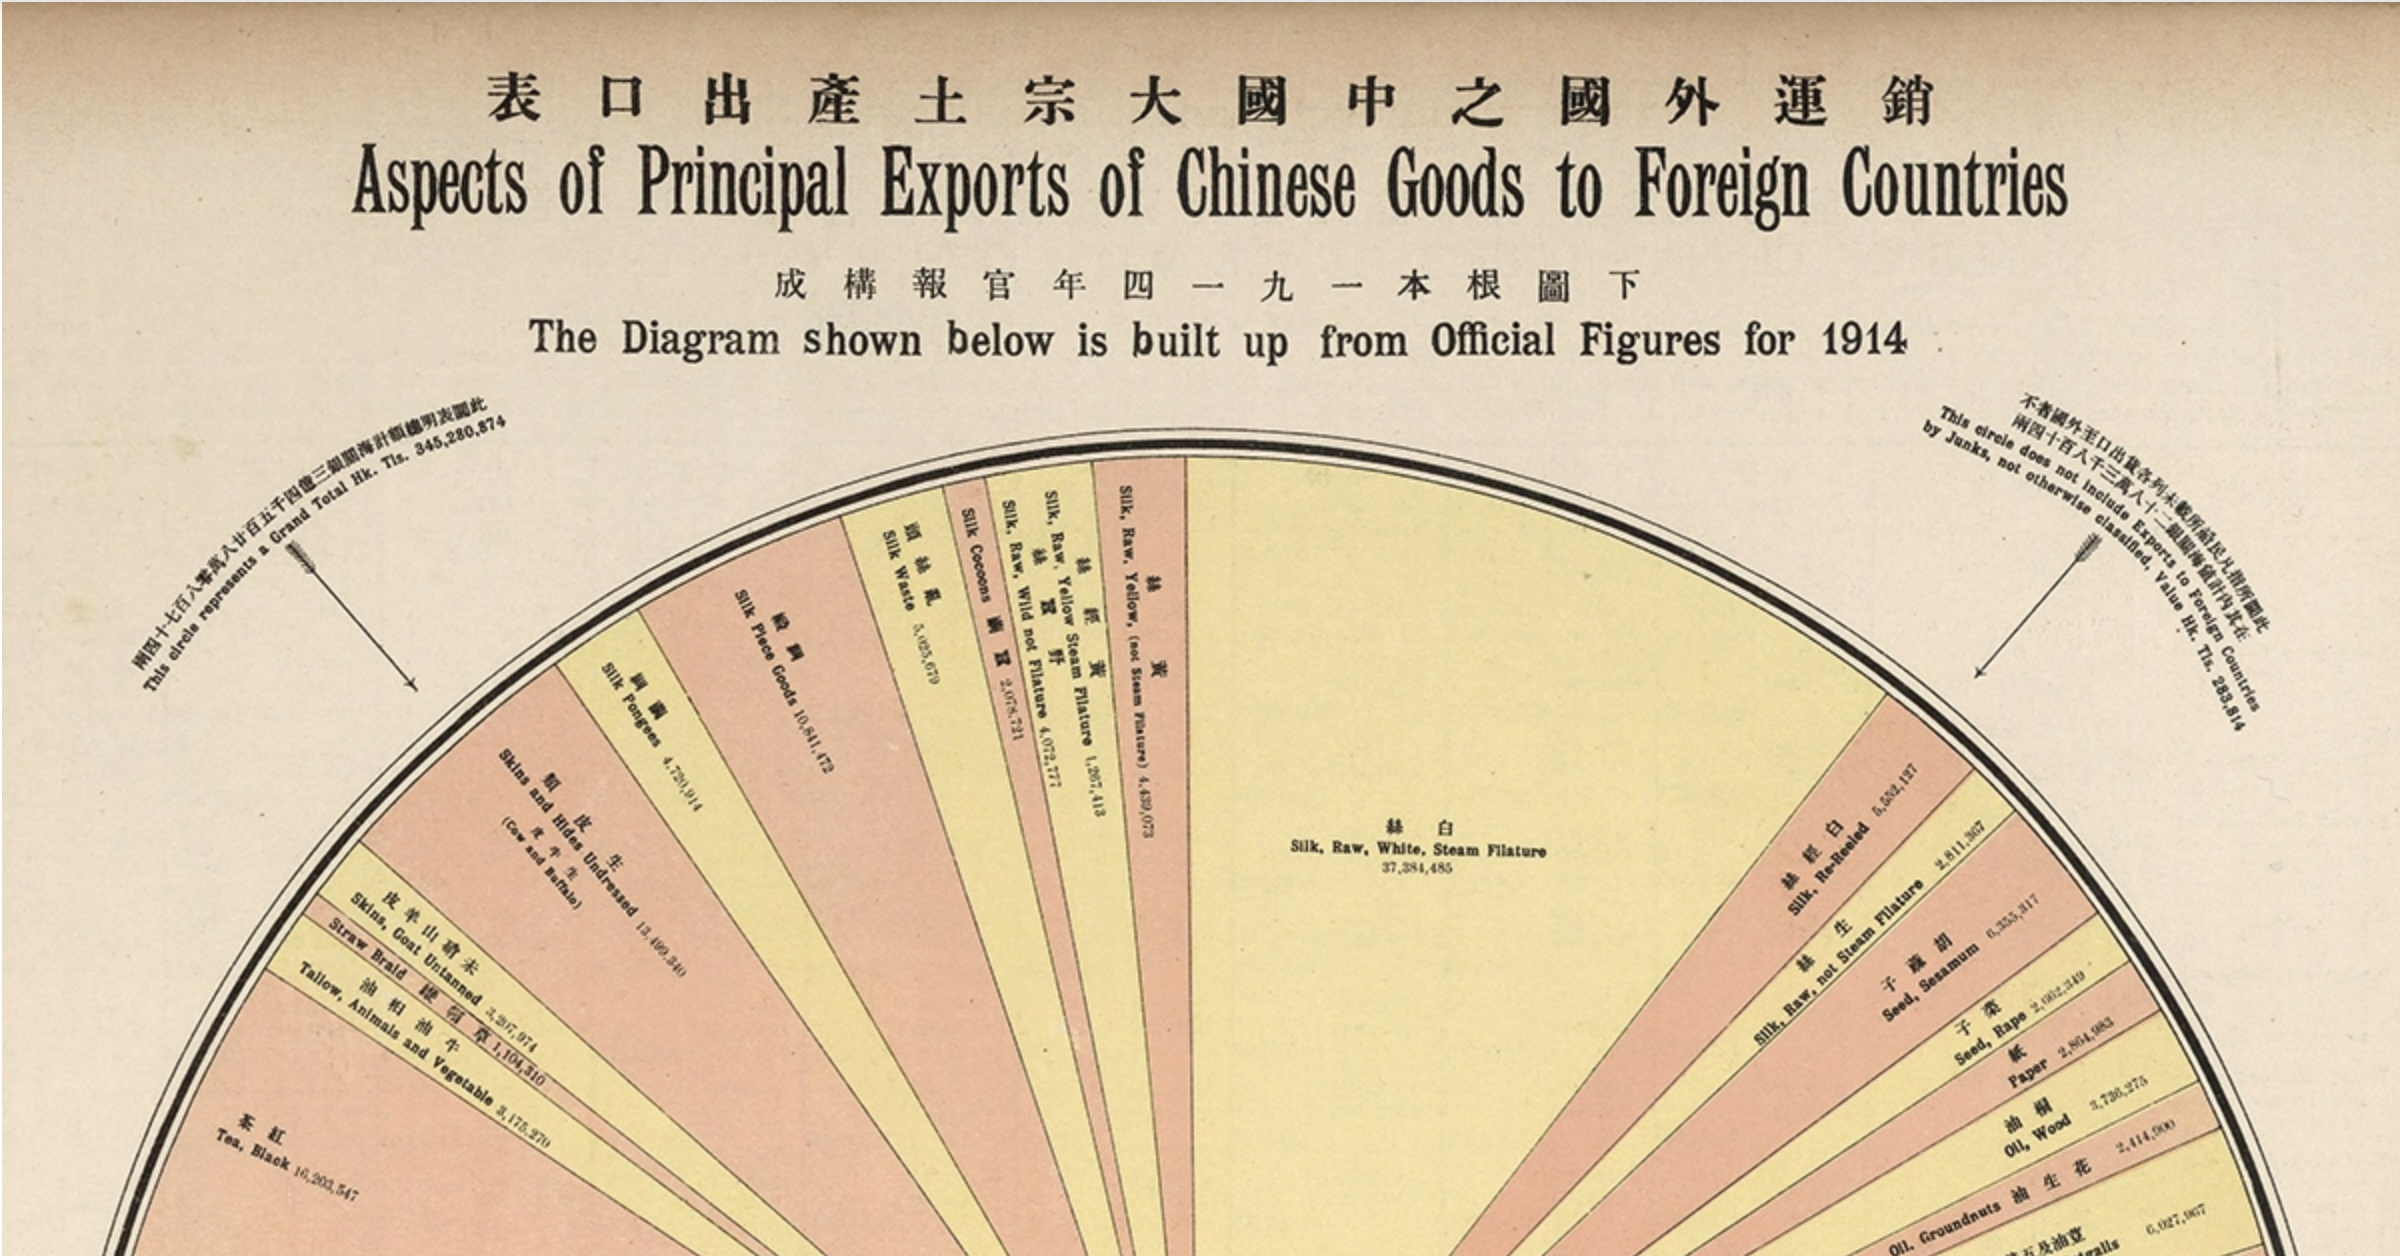
on A statement that is as profound as it is banal. In other words, when we do history, we’re a bit like tourists. If we really want to understand the past, we have to think like a local. The infographic above, Aspects of Principal Exports of Chinese Goods to Foreign Countries, is the first in a series that we’re calling Vintage Viz, which presents a historical visualization along with the background and analytical tools to make sense of it. Today, the People’s Republic of China is the second largest economy in the world, a permanent member of the UN Security Council, and a growing military power. But at the dawn of the 20th century, things were much, much different.
Opium and the Opening of China to the West
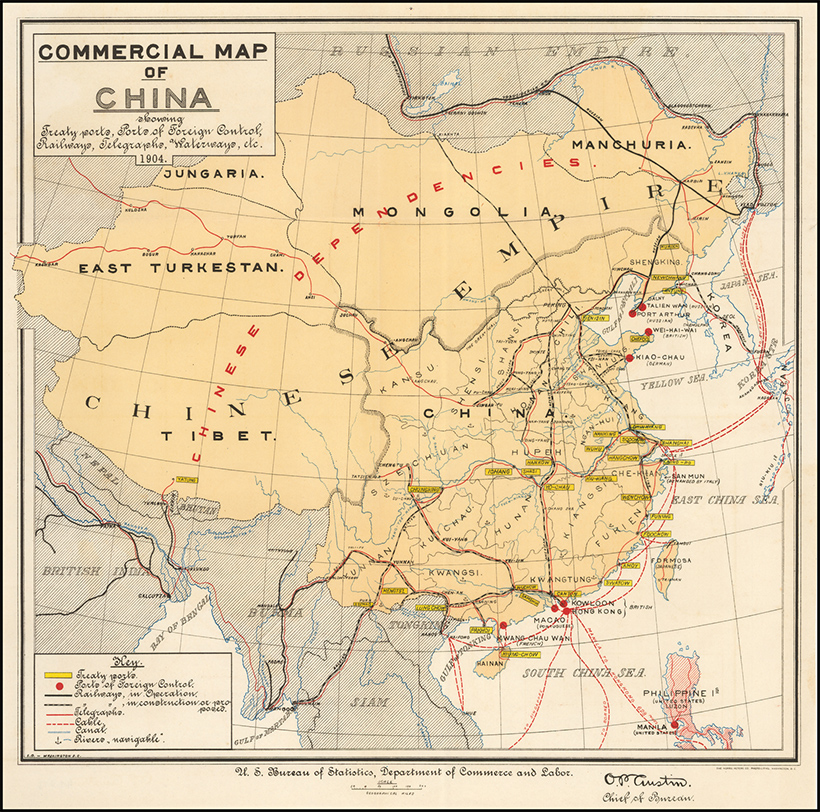
Early Sino-Western trade was restricted by the Qing emperors to three ports, and after 1757, just one, in what became known as the Canton System. This name came from the one remaining port city of the same name, present-day Guangzhou. Foreign trade was tightly monitored and subject to stiff tariffs, and Western traders chafed under these restrictions. So when in 1839, Chinese authorities moved to shut down opium smuggling—an important source of profit for foreign merchants—Western powers saw their chance and used the pretext to revise the terms of trade by force. In what became known as the Opium Wars, 1839-1842 and 1856-1860, first Great Britain and then an Anglo-French alliance defeated imperial China and imposed punitive treaties that included indemnities and lowered tariffs, but also expanded the number of ports open to foreign traders, first to five and by 1911, to more than 50.
Westerners were exempted from local laws, Christian missionaries were allowed to proselytize freely, and the opium trade was legalized. Hong Kong was also ceded to Great Britain at this time. The Treaty Port Era, also known as the Century of Humiliation, was perhaps too much for the country to bear. The weakened central government was beset by popular unrest, including the Taiping Rebellion (1850–64), which killed 20 million people, and the Boxer Rebellion (1899-1901), so-named for the secret society that led the movement, the Righteous and Harmonious Fists. Eventually, the last Chinese emperor was deposed and a republic declared in 1911. Nevertheless, the government was too weak to impose its will, and was repeatedly challenged by warlords. So as we approach the outbreak of the First World War in 1914, and the period covered by our visualization, we find China weakened internally by civil strife, and externally by Western powers.
The History of this Century-Old Pie Chart
Aspects of Principal Exports of Chinese Goods to Foreign Countries captures Chinese exports for 1914, and comes from The New Atlas and Commercial Gazetteer of China: A Work Devoted to Its Geography & Resources and Economic & Commercial Development. Originally published in 1917 and edited by Edwin J. Dingle for the Far Eastern Geographical Establishment, the volume contains a wealth of data for the period. According to the book’s Preface, it “seeks to give all the information that is essential to the business-man in regard to a country… about which less is known than in regard to any similar area in the world.” The visualization breaks down total Chinese exports for 1914 in haikwan taels (hk. tls.), a unit of silver currency used to collect tariffs. In 1907, one haikwan tael was worth $0.79 U.S. dollars. Official figures come from the Chinese Maritime Customs Service. This was set up by foreign consuls after the First Opium War to collect tariffs to guarantee the payment of treaty indemnities. Exports in 1914 represented 345 million hk. tls., a 14.4% decrease from 1913, likely owing to the outbreak of the First World War that same year. Apart from “Other Metals and Minerals, Sundries, etc,” which served as a catch-all category, the largest categories were silks and teas of various types, representing 22.6% and 10.4% of total exports respectively. Below are some more details that emerge from this visualization.
All the Tea in China
The Chinese tea trade was the subject of another visualization in the Atlas. It shows that China had been steadily losing ground to British India. Between 1888-1892 Chinese exports to Great Britain were 242 million pounds against India’s 105 million pounds. By 1912-1913, India had surpassed China to export 279 million pounds against 198 million pounds. In 1914, the majority of Chinese exports went to Russia, 902,716 piculs in all. A picul is equal to “as much as a man can carry on a shoulder-pole” or about 133 pounds.
The Silk Road to Profits
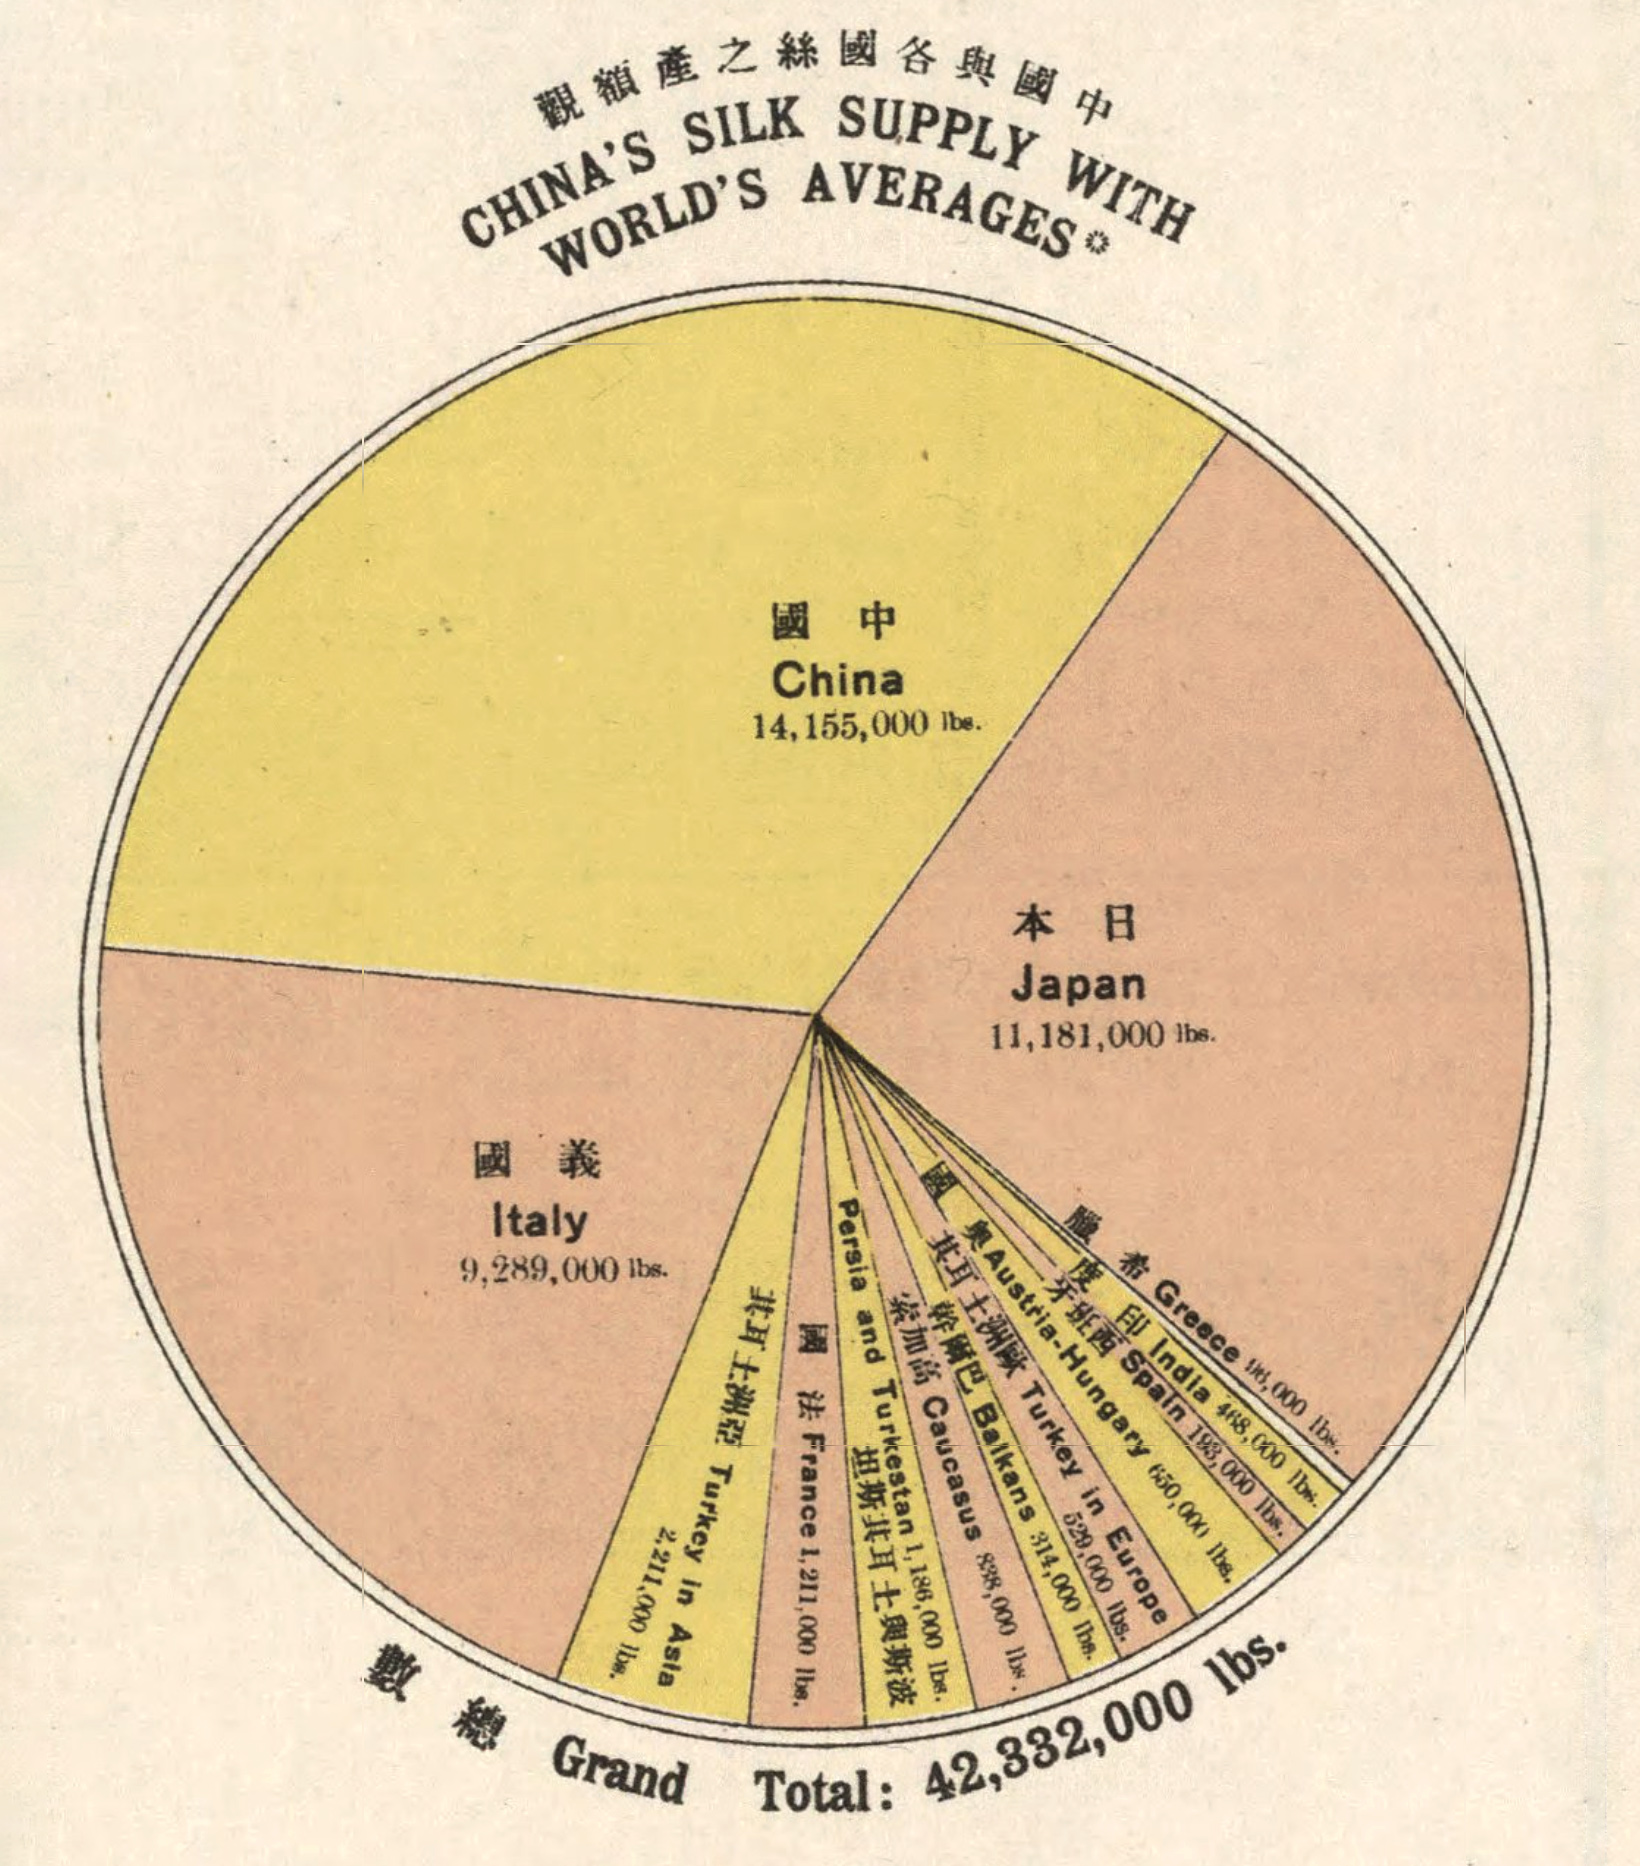
Silk has long been in demand in the West as a luxury good, giving its name to the overland trade route that connected East and West for centuries: the Silk Road. In 1914, China was the largest producer and exporter of silks in the world. On an annual basis, China averaged 14 million pounds, compared to the number two spot, Japan, at 11 million pounds, and number three, Italy, at 9 million pounds. Together, these three controlled 81.7% of the global silk trade.
The Opium of the Masses?
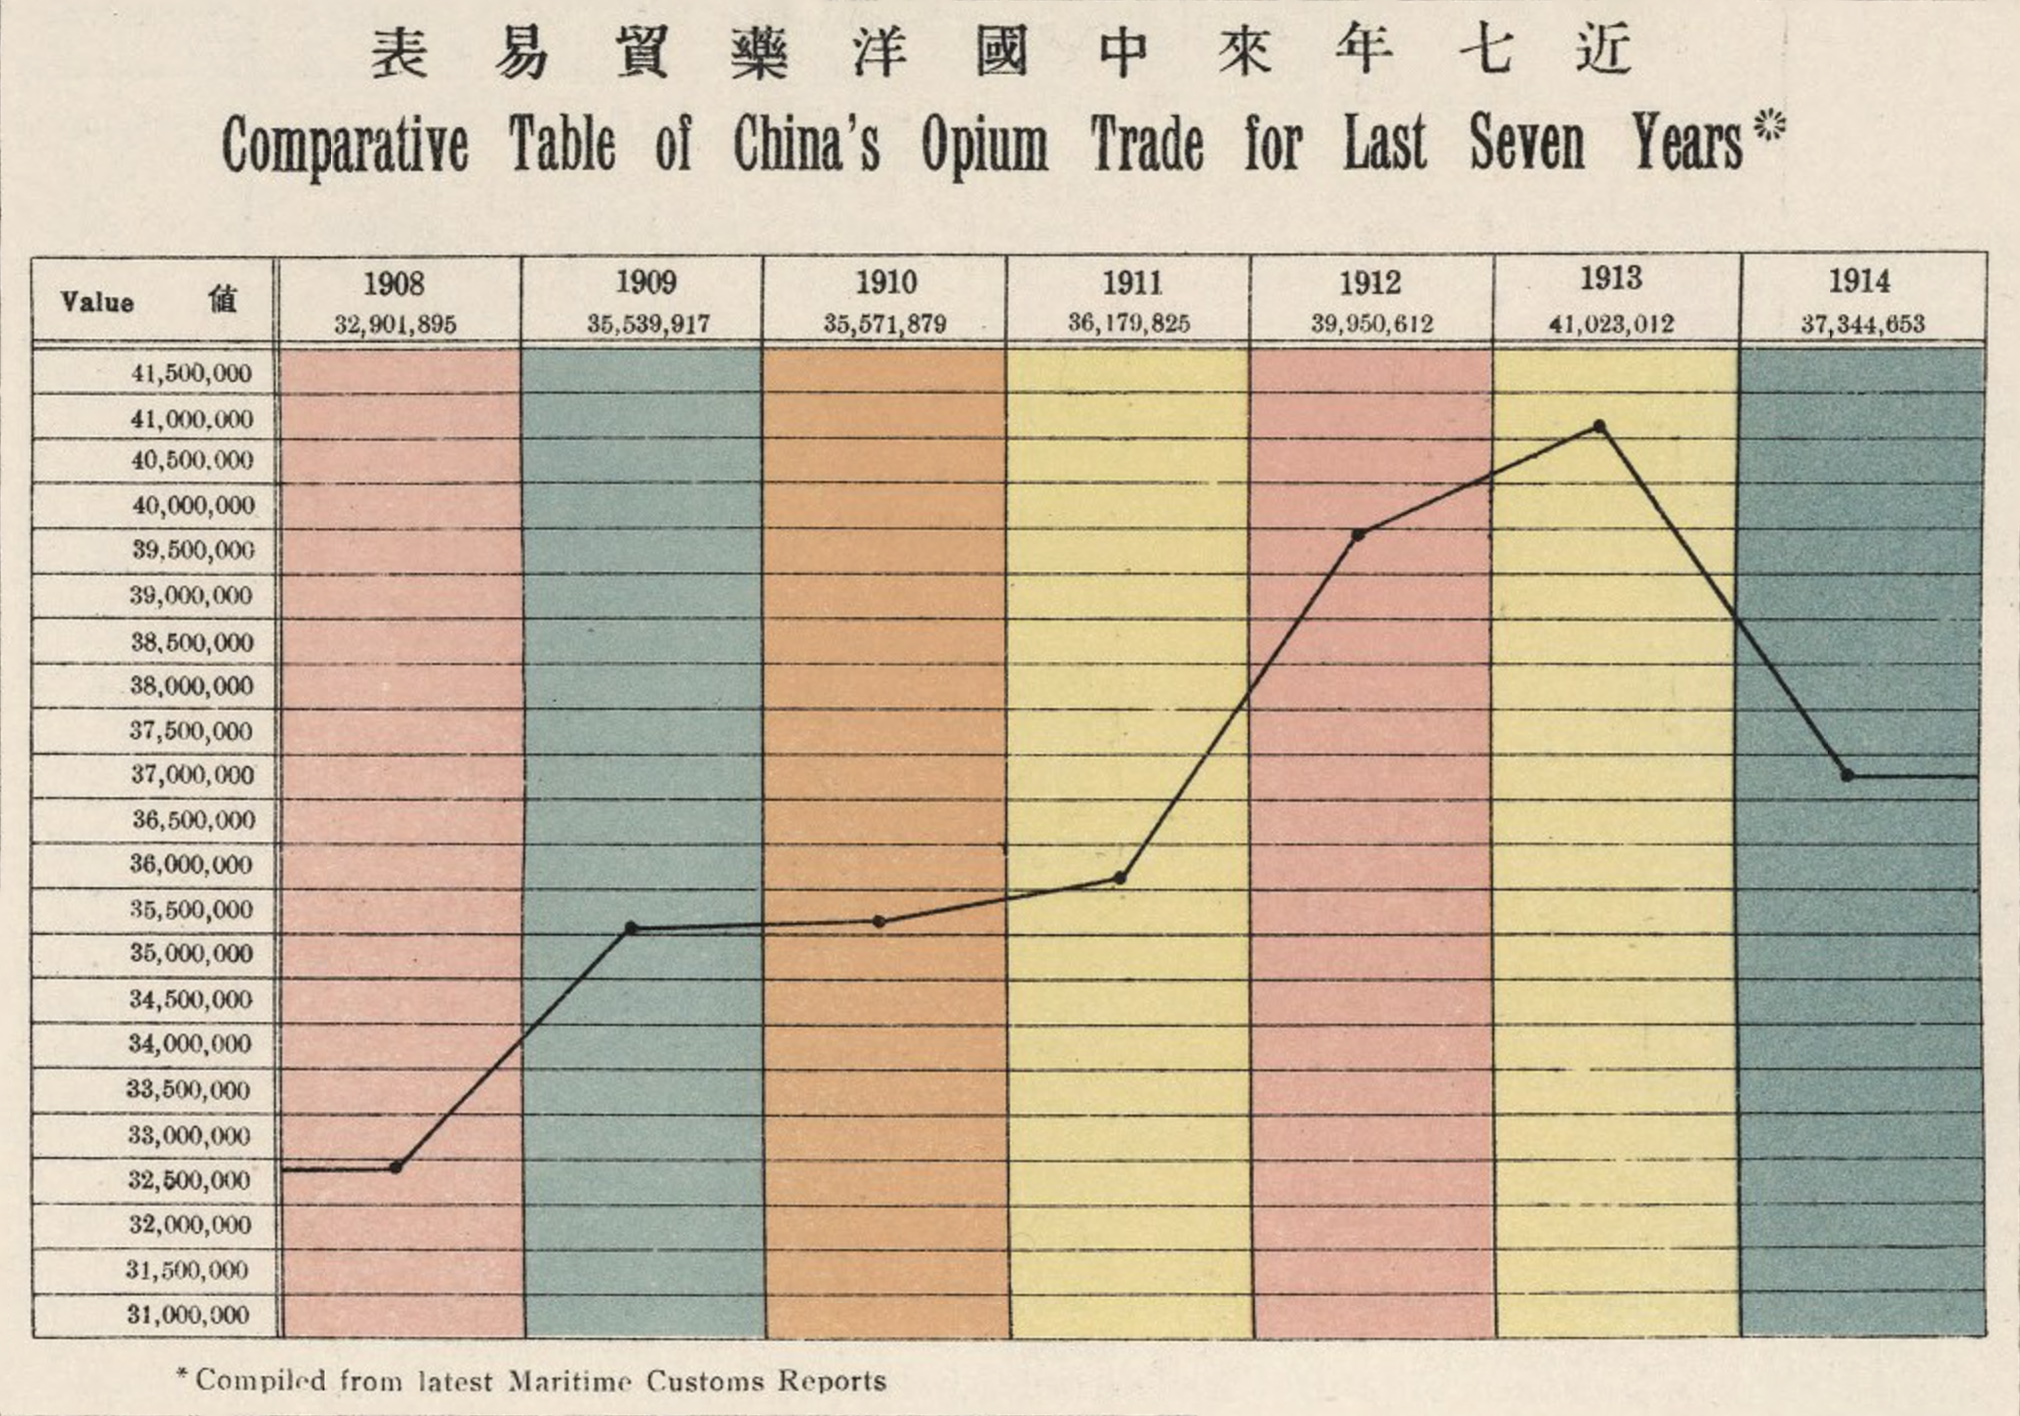
The opium trade, the pretext that opened China to foreign trade, was still big money in 1914. A total of 37 million hk. tls. were imported in 1914 from India, up 11.9% from 1908. This is actually down from a peak of 41 million hk. tls. in 1913.
In 1907, China signed the Ten Year Agreement with India, which ultimately phased out the opium trade. By 1917 the trade was all but extinguished.
Back to the Future
The Aspects of Principal Exports of Chinese Goods to Foreign Countries is a far cry from the contemporary trade picture. China’s top export in 2021 was in the category “telephones for cellular networks or other wireless networks,” and was worth $147.1 billion. But it’s worth noting that China today is a direct result of this period. The resentment created during the Century of Humiliation would eventually help lead to Mao Zedong, the Long March, and the establishment of the People’s Republic of China. And in 1979, the Chinese central government would set up the first of their own “treaty ports,” in the form of special economic zones, places where foreign companies could set up shop. But this time, it wasn’t foreign powers who were making the rules.