Today’s animation comes from Reddit user /u/rebellious_scum and it charts North American box office sales for select movie franchises, as reported by movie data website The Numbers. The daily ticket earnings were captured from May 19, 1999 (release date of Star Wars: Episode I) to April 4, 2019 and adjusted for inflation. What stands out the most? The clear takeaway from the animation is Marvel’s exponential earnings growth since it debuted with Iron Man in 2008. As of April 4, the franchise had earned inflation-adjusted revenue of $7.63 billion – almost double that of runner-up Star Wars, which totaled $4.03 billion. Of course, this does not take into account data from the record-shattering release of Avengers: Endgame on April 26th, which would skew numbers in Marvel’s favor even more.
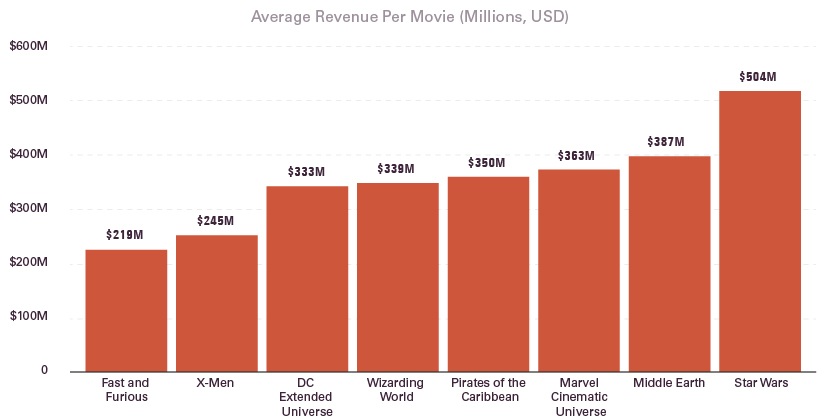
Average Revenue Per Movie
While these numbers sound impressive, what’s the average revenue each movie has generated in North America?
Using the animation’s inflation-adjusted numbers, here’s how it all breaks down:
Star Wars and Middle Earth top the list in terms of average revenue per movie. Meanwhile, Marvel lands in third place and is closely followed by Pirates of the Caribbean, the Wizarding World, and the DC Extended Universe (DCEU).
Compared to direct competitor DCEU, Marvel earns roughly $30 million more per movie.
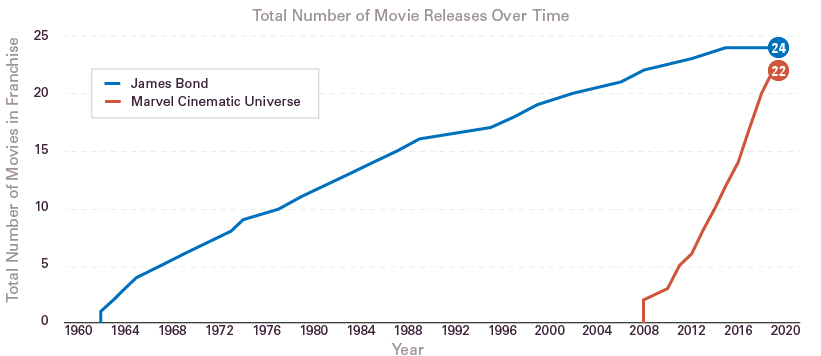
The Rate of Movie Production
The secret, in part, to Marvel’s astronomical surge? They produce movies at breakneck speed. The studio knows it has a winning recipe, and cooks up movies quickly to stay fresh in viewers’ minds. In twelve years, Marvel Studios has produced 22 movies including Avengers: Endgame. By comparison, the giant James Bond franchise has produced 24 movies since its inception 57 years ago in 1962. Source: 007.com, Marvel.com
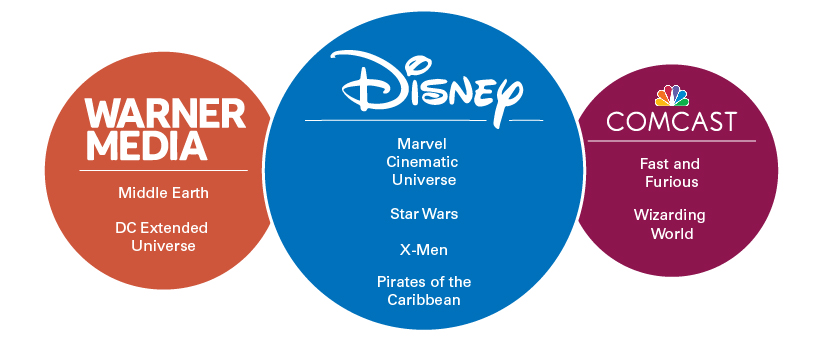
The Market Share Leaders
With Disney’s recent purchase of Fox, the ownership of movie franchises became even more concentrated. Today, Hollywood essentially has three parent companies: The Walt Disney Company, Universal/Comcast Corp., and WarnerMedia (previously TimeWarner). Here’s who owns the above eight franchises: Sources: Business Insider, Forbes, Fortune, The Tolkien Society Disney is a major player in the franchise space, and shows no signs of slowing down. There are even talks that the company is looking to reboot the Pirates of the Caribbean franchise. In an industry full of risk, studios are looking to capitalize on a winning franchise formula: build a trusted brand with beloved characters, and produce movies as fast as time will allow. on Last year, stock and bond returns tumbled after the Federal Reserve hiked interest rates at the fastest speed in 40 years. It was the first time in decades that both asset classes posted negative annual investment returns in tandem. Over four decades, this has happened 2.4% of the time across any 12-month rolling period. To look at how various stock and bond asset allocations have performed over history—and their broader correlations—the above graphic charts their best, worst, and average returns, using data from Vanguard.
How Has Asset Allocation Impacted Returns?
Based on data between 1926 and 2019, the table below looks at the spectrum of market returns of different asset allocations:
We can see that a portfolio made entirely of stocks returned 10.3% on average, the highest across all asset allocations. Of course, this came with wider return variance, hitting an annual low of -43% and a high of 54%.
A traditional 60/40 portfolio—which has lost its luster in recent years as low interest rates have led to lower bond returns—saw an average historical return of 8.8%. As interest rates have climbed in recent years, this may widen its appeal once again as bond returns may rise.
Meanwhile, a 100% bond portfolio averaged 5.3% in annual returns over the period. Bonds typically serve as a hedge against portfolio losses thanks to their typically negative historical correlation to stocks.
A Closer Look at Historical Correlations
To understand how 2022 was an outlier in terms of asset correlations we can look at the graphic below:
The last time stocks and bonds moved together in a negative direction was in 1969. At the time, inflation was accelerating and the Fed was hiking interest rates to cool rising costs. In fact, historically, when inflation surges, stocks and bonds have often moved in similar directions. Underscoring this divergence is real interest rate volatility. When real interest rates are a driving force in the market, as we have seen in the last year, it hurts both stock and bond returns. This is because higher interest rates can reduce the future cash flows of these investments. Adding another layer is the level of risk appetite among investors. When the economic outlook is uncertain and interest rate volatility is high, investors are more likely to take risk off their portfolios and demand higher returns for taking on higher risk. This can push down equity and bond prices. On the other hand, if the economic outlook is positive, investors may be willing to take on more risk, in turn potentially boosting equity prices.
Current Investment Returns in Context
Today, financial markets are seeing sharp swings as the ripple effects of higher interest rates are sinking in. For investors, historical data provides insight on long-term asset allocation trends. Over the last century, cycles of high interest rates have come and gone. Both equity and bond investment returns have been resilient for investors who stay the course.