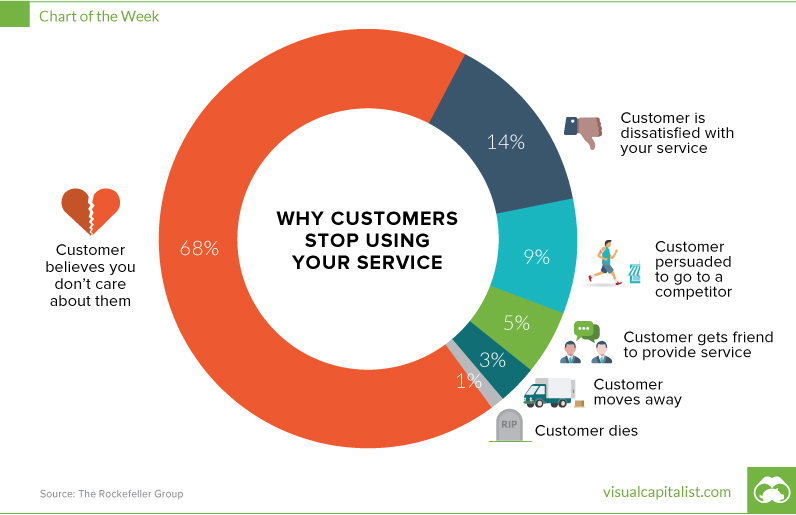
One of the most important questions facing a business of any size is: why do your customers leave? It doesn’t matter if you are a part of a Fortune 500 firm, or if you are a local plumber that works out of a van. This question should be important to you, because it has a huge impact on your livelihood. Oddly enough, it turns out the answer to the question could be deceivingly simple. Businesses just don’t seem to care enough about their customers.
Even if your product is mediocre. Even if you are technologically behind your competitors. Even if your prices are higher – if you actually care about your customers, you will still have a chance at keeping them on board. That’s because people want to work with companies that have “skin in the game” with their clients. They want you to fight for them, and to be noticeably invested in their success. Yes, you still have to deliver on your promises, but just showing your ongoing commitment to their problems will go a long way.
Here’s the Disconnect
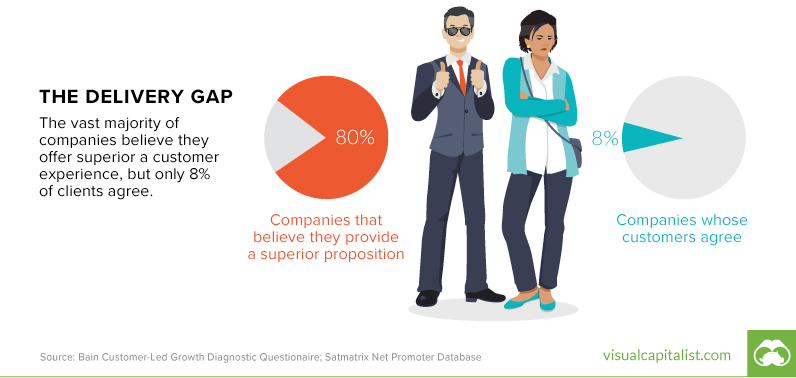
If you are thinking that the above fact is obvious, then you are not alone. There are thousands of companies across the world that have deemed customer service to be their big competitive advantage. They have company rallies where they talk about putting the customer first, and their internal messaging is all around how being “customer-centric” is the engine behind the company’s success. The problem (and the opportunity) is that although everyone says they are focused on solving the problems of their customers, nobody actually executes on this promise successfully. Consulting firm Bain & Company calls this the “Delivery Gap”:
It’s like a New Year’s Resolution. Almost everybody makes them, but no one actually keeps them. But it’s a huge opportunity. If everyone says that they are customer-centric but only very few actually deliver, that means that clients are rightly skeptical about such a claim. It’s your opportunity to turn their outlook upside-down by unexpectedly hopping right into the trenches with them. Once they see you fighting for them on a personal basis, it will make a world of difference.
The Proof is in the Pudding
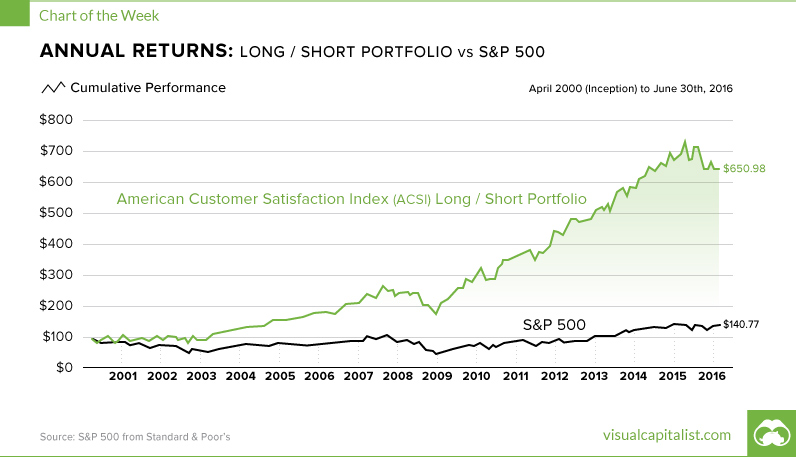
These types of customer relationships translate to real success, even in the stock market:
This is the American Customer Satisfaction Index (ACSI) long/short portfolio. Basically it represents the idea of buying equity in companies that have high levels of customer satisfaction, while betting against the companies that customers hate. The end result? Consistent outperformance against the S&P 500 over the last 16 years. Real customer service translates to real wins, and it will likely allow you to decrease client turnover, while upping the lifetime value of each customer.
on Last year, stock and bond returns tumbled after the Federal Reserve hiked interest rates at the fastest speed in 40 years. It was the first time in decades that both asset classes posted negative annual investment returns in tandem. Over four decades, this has happened 2.4% of the time across any 12-month rolling period. To look at how various stock and bond asset allocations have performed over history—and their broader correlations—the above graphic charts their best, worst, and average returns, using data from Vanguard.
How Has Asset Allocation Impacted Returns?
Based on data between 1926 and 2019, the table below looks at the spectrum of market returns of different asset allocations:
We can see that a portfolio made entirely of stocks returned 10.3% on average, the highest across all asset allocations. Of course, this came with wider return variance, hitting an annual low of -43% and a high of 54%.
A traditional 60/40 portfolio—which has lost its luster in recent years as low interest rates have led to lower bond returns—saw an average historical return of 8.8%. As interest rates have climbed in recent years, this may widen its appeal once again as bond returns may rise.
Meanwhile, a 100% bond portfolio averaged 5.3% in annual returns over the period. Bonds typically serve as a hedge against portfolio losses thanks to their typically negative historical correlation to stocks.
A Closer Look at Historical Correlations
To understand how 2022 was an outlier in terms of asset correlations we can look at the graphic below:
The last time stocks and bonds moved together in a negative direction was in 1969. At the time, inflation was accelerating and the Fed was hiking interest rates to cool rising costs. In fact, historically, when inflation surges, stocks and bonds have often moved in similar directions. Underscoring this divergence is real interest rate volatility. When real interest rates are a driving force in the market, as we have seen in the last year, it hurts both stock and bond returns. This is because higher interest rates can reduce the future cash flows of these investments. Adding another layer is the level of risk appetite among investors. When the economic outlook is uncertain and interest rate volatility is high, investors are more likely to take risk off their portfolios and demand higher returns for taking on higher risk. This can push down equity and bond prices. On the other hand, if the economic outlook is positive, investors may be willing to take on more risk, in turn potentially boosting equity prices.
Current Investment Returns in Context
Today, financial markets are seeing sharp swings as the ripple effects of higher interest rates are sinking in. For investors, historical data provides insight on long-term asset allocation trends. Over the last century, cycles of high interest rates have come and gone. Both equity and bond investment returns have been resilient for investors who stay the course.