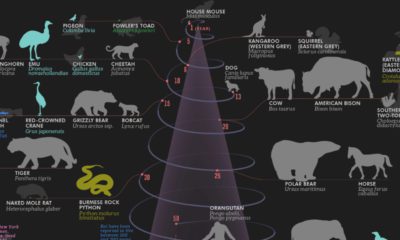
Outbreaks, war, and famine would still kill millions of people at regular intervals. These issues are still stubbornly present in 21st century society, but broadly speaking, the situation around the world has vastly improved. Today, most of humanity lives in countries where the life expectancy is above the typical retirement age of 65. At the same time, while inequality remains a hot button topic within countries, income disparity between countries is slowing beginning to narrow. This animated visualization, created by James Eagle, tracks the evolution of health and wealth factors in countries around the world. For further exploration, Gapminder also has a fantastic interactive chart that showcases the same dataset.
The Journey to the Upper-Right Quadrant
In general terms, history has seen health practices improve and countries become increasingly wealthy–trends that are reflected in this visualization. In fact, most countries drift towards the upper-right quadrant over the 221 years covered in the dataset. However, that path to the top-right, which indicates high levels of both life expectancy and GDP per capita, is rarely a linear journey. Here are some of the noteworthy events and milestones to watch out for while viewing the animation. 1880s: Breaking the 50-Year Barrier In the late 19th century, Nordic countries such as Sweden and Norway already found themselves past the 50-year life expectancy mark. This was a significant milestone considering the global life expectancy was a full 20 years shorter at the time. It wasn’t until the year 1960 that the global life expectancy would catch up. 1918: The Spanish Flu and WWI At times, a confluence of factors can impact health and wealth in countries and regions. In this case, World War I coincided with one of the deadliest pandemics in history, leading to global implications. In the animation, this is abundantly clear as the entire cluster of circles takes a nose dive for a short period of time. 1933, 1960: Communist Famines At various points in history, human decisions can have catastrophic consequences. This was the case in the Soviet Union (1933) and the People’s Republic of China (1960), where life expectancy plummeted during famines that killed millions of people. These extreme events are easy to spot in the animation due to the large populations of the countries in question. 1960s: Oil Economies Kick into High Gear During this time, Iran, Iraq, and Saudi Arabia all experience massive booms in wealth, and in the following decade, smaller countries such as the United Arab Emirates and Kuwait rocket to the right edge of the visualization.
In following decades, both Iran and Iraq can be seen experiencing wild fluctuations in both health and wealth as regime changes and conflict begin to destabilize the region. 1990s: AIDS in Africa In the animation, a number of countries plummet in unison at the end of the 20th century. These are sub-Saharan African countries that were hit hard by the AIDS pandemic. At its peak in the early ’00s, the disease accounted for more than half of deaths in some countries.
1995: Breaking the 65-Year Barrier Global life expectancy reaches retirement age. At this point in time, there is a clear divide in both health and wealth between African and South Asian countries and the rest of the world. Thankfully, that gap is would continue to narrow in coming years. 1990-2000s: China’s Economic Rise With a population well over a billion people, it’s impossible to ignore China in any global overview. Starting from the early ’90s, China begins its march from the left to right side of the chart, highlighting the unprecedented economic growth it experienced during that time.
What the Future Holds
If current trends continue, global life expectancy is expected to surpass the 80-year mark by 2100. And, sub-Saharan Africa, which has the lowest life expectancy today, is expected to mostly close the gap, reaching 75 years of age. Wealth is also expected to increase nearly across the board, with the biggest gains coming from places like Vietnam, Nigeria, and the Philippines. Some experts are projecting the world economy as a whole to double in size by 2050. There are always bumps along the way, but it appears that the journey to the upper-right quadrant is still very much underway. on Both figures surpassed analyst expectations by a wide margin, and in January, the unemployment rate hit a 53-year low of 3.4%. With the recent release of February’s numbers, unemployment is now reported at a slightly higher 3.6%. A low unemployment rate is a classic sign of a strong economy. However, as this visualization shows, unemployment often reaches a cyclical low point right before a recession materializes.
Reasons for the Trend
In an interview regarding the January jobs data, U.S. Treasury Secretary Janet Yellen made a bold statement: While there’s nothing wrong with this assessment, the trend we’ve highlighted suggests that Yellen may need to backtrack in the near future. So why do recessions tend to begin after unemployment bottoms out?
The Economic Cycle
The economic cycle refers to the economy’s natural tendency to fluctuate between periods of growth and recession. This can be thought of similarly to the four seasons in a year. An economy expands (spring), reaches a peak (summer), begins to contract (fall), then hits a trough (winter). With this in mind, it’s reasonable to assume that a cyclical low in the unemployment rate (peak employment) is simply a sign that the economy has reached a high point.
Monetary Policy
During periods of low unemployment, employers may have a harder time finding workers. This forces them to offer higher wages, which can contribute to inflation. For context, consider the labor shortage that emerged following the COVID-19 pandemic. We can see that U.S. wage growth (represented by a three-month moving average) has climbed substantially, and has held above 6% since March 2022. The Federal Reserve, whose mandate is to ensure price stability, will take measures to prevent inflation from climbing too far. In practice, this involves raising interest rates, which makes borrowing more expensive and dampens economic activity. Companies are less likely to expand, reducing investment and cutting jobs. Consumers, on the other hand, reduce the amount of large purchases they make. Because of these reactions, some believe that aggressive rate hikes by the Fed can either cause a recession, or make them worse. This is supported by recent research, which found that since 1950, central banks have been unable to slow inflation without a recession occurring shortly after.
Politicians Clash With Economists
The Fed has raised interest rates at an unprecedented pace since March 2022 to combat high inflation. More recently, Fed Chairman Jerome Powell warned that interest rates could be raised even higher than originally expected if inflation continues above target. Senator Elizabeth Warren expressed concern that this would cost Americans their jobs, and ultimately, cause a recession. Powell remains committed to bringing down inflation, but with the recent failures of Silicon Valley Bank and Signature Bank, some analysts believe there could be a pause coming in interest rate hikes. Editor’s note: just after publication of this article, it was confirmed that U.S. interest rates were hiked by 25 basis points (bps) by the Federal Reserve.