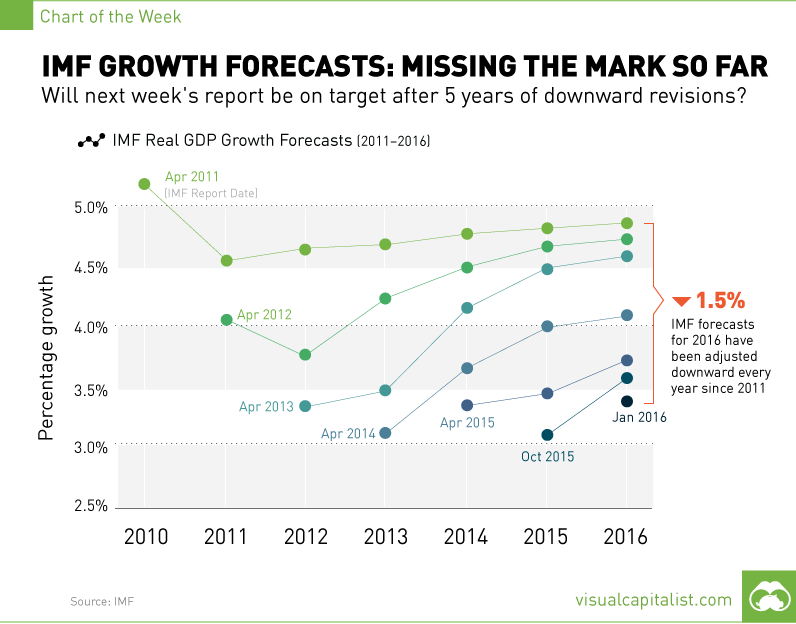
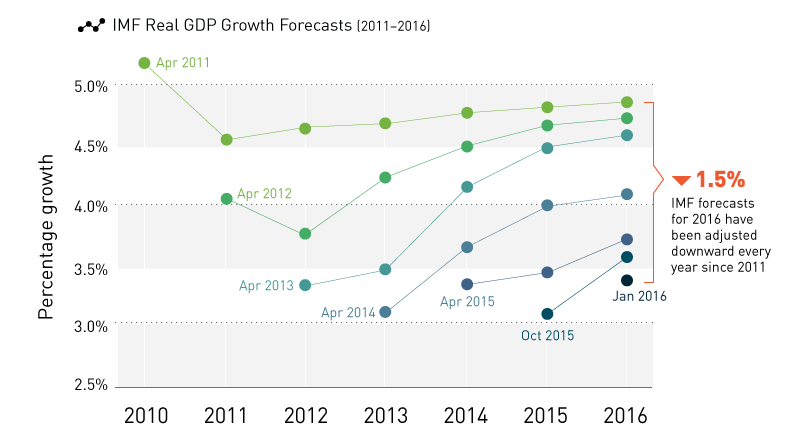
IMF Growth Forecasts: Missing the Mark So Far [Chart]
Will next week’s report be on target after 5 years of downward revisions?
The Chart of the Week is a weekly Visual Capitalist feature on Fridays. Projections on the global economic recovery have been overestimated by most policymakers and institutions for some time now. The International Monetary Fund (IMF) has been no exception to this fallacy. Whether it is simple error, wishful thinking, or a complex system that is to blame, the economists at the IMF have now missed the mark for five years in a row on their global real GDP growth forecasts. After multiple revisions downward, their most recent January 2016 report finally estimated growth for this year to be a mediocre 3.4%. Of course, no one expects economists to be anywhere near perfect. However, what is troubling in this instance is that all estimates have erred on the side of being overly optimistic. This makes it difficult for investors, businesses, and governments to ground their expectations and to manage their assets.
Frontrunning
This upcoming week, the IMF will release their latest World Economic Outlook (WEO) report, summarizing key economic figures as well as their forecasted growth for 2016 and the years ahead. Will they miss the mark again, or will their projections finally line up with economic realities? In recent weeks, IMF head Christine Lagarde has hit the press circuit to possibly set expectations ahead of the new report’s release. In Frankfurt, she had this to say on April 5, potentially revealing some clues for us: She went on to suggest that a strong U.S. dollar, high unemployment and shoddy balance sheets in Europe, and economic data from Japan have all reduced growth in key developed countries. Further, emerging markets such as China, Brazil, and Russia had all faced more challenges than expected, and that the Middle East’s growth got hammered by weak energy prices. Meanwhile, Lagarde saw India, Indonesia, Malaysia, Philippines, Thailand, and Vietnam as bright spots. Later in the speech, she pulled no punches on potential global risks, mentioning “high debt” as the first risk to making recovery progress: While Lagarde made it clear that there has been a “loss of momentum” and that the IMF is “on alert, not alarm”, this could be a clue that the reality is setting in for the IMF: a sustained, real recovery is not in the cards unless giant obstacles are overcome. We believe this could take a prolonged time to truly correct, or that it could eventually happen after a major reset to our financial and political systems. Either way, for once it seems possible (though improbable), that the IMF may finally see things the same way.
on The good news is that the Federal Reserve, U.S. Treasury, and Federal Deposit Insurance Corporation are taking action to restore confidence and take the appropriate measures to help provide stability in the market. With this in mind, the above infographic from New York Life Investments looks at the factors that impact bonds, how different types of bonds have historically performed across market environments, and the current bond market volatility in a broader context.
Bond Market Returns
Bonds had a historic year in 2022, posting one of the worst returns ever recorded. As interest rates rose at the fastest pace in 40 years, it pushed bond prices lower due to their inverse relationship. In a rare year, bonds dropped 13%.
Source: FactSet, 01/02/2023.
Bond prices are only one part of a bond’s total return—the other looks at the income a bond provides. As interest rates have increased in the last year, it has driven higher bond yields in 2023.
Source: YCharts, 3/20/2023.
With this recent performance in mind, let’s look at some other key factors that impact the bond market.
Factors Impacting Bond Markets
Interest rates play a central role in bond market dynamics. This is because they affect a bond’s price. When rates are rising, existing bonds with lower rates are less valuable and prices decline. When rates are dropping, existing bonds with higher rates are more valuable and their prices rise. In March, the Federal Reserve raised rates 25 basis points to fall within the 4.75%-5.00% range, a level not seen since September 2007. Here are projections for where the federal funds rate is headed in 2023:
Federal Reserve Projection*: 5.1% Economist Projections**: 5.3%
*Based on median estimates in the March summary of quarterly economic projections.**Projections based on March 10-15 Bloomberg economist survey. Together, interest rates and the macroenvironment can have a positive or negative effect on bonds.
Positive
Here are three variables that may affect bond prices in a positive direction:
Lower Inflation: Reduces likelihood of interest rate hikes. Lower Interest Rates: When rates are falling, bond prices are typically higher. Recession: Can prompt a cut in interest rates, boosting bond prices.
Negative
On the other hand, here are variables that may negatively impact bond prices:
Higher Inflation: Can increase the likelihood of the Federal Reserve to raise interest rates. Rising Interest Rates: Interest rate hikes lead bond prices to fall. Weaker Fundamentals: When a bond’s credit risk gets worse, its price can drop. Credit risk indicates the chance of a default, the risk of a bond issuer not making interest payments within a given time period.
Bonds have been impacted by these negative factors since inflation started rising in March 2021.
Fixed Income Opportunities
Below, we show the types of bonds that have had the best performance during rising rates and recessions.
Source: Derek Horstmeyer, George Mason University 12/3/2022. As we can see, U.S. ultrashort bonds performed the best during rising rates. Mortgage bonds outperformed during recessions, averaging 11.4% returns, but with higher volatility. U.S. long-term bonds had 7.7% average returns, the best across all market conditions. In fact, they were also a close second during recessions. When rates are rising, ultrashort bonds allow investors to capture higher rates when they mature, often with lower historical volatility.
A Closer Look at Bond Market Volatility
While bond market volatility has jumped this year, current dislocations may provide investment opportunities. Bond dislocations allow investors to buy at lower prices, factoring in that the fundamental quality of the bond remains strong. With this in mind, here are two areas of the bond market that may provide opportunities for investors:
Investment-Grade Corporate Bonds: Higher credit quality makes them potentially less vulnerable to increasing interest rates. Intermediate Bonds (2-10 Years): Allow investors to lock in higher rates.
Both types of bonds focus on quality and capturing higher yields when faced with challenging market conditions.
Finding the Upside
Much of the volatility seen in the banking sector was due to banks buying bonds during the pandemic—or even earlier—at a time when interest rates were historically low. Since then, rates have climbed considerably. Should rates moderate or stop increasing, this may present better market conditions for bonds. In this way, today’s steep discount in bond markets may present an attractive opportunity for price appreciation. At the same time, investors can potentially lock in strong yields as inflation may subside in the coming years ahead. Learn more about bond investing strategies with New York Life Investments.