Not only are you up against the world’s best investors, but you’re also up against yourself. It’s easy to get caught making irrational decisions based on your own personal blindspots or cognitive biases, and these mistakes can lead to buying when you should sell, and vice versa. For the above reasons, the most successful investors are often those that have rational and proven systems in place. Having a method to your madness allows you to have confidence in your decisions, while also taking advantage of the strategies and heuristics that have performed well for the world’s most elite investors.
How to Pick Growth Stocks
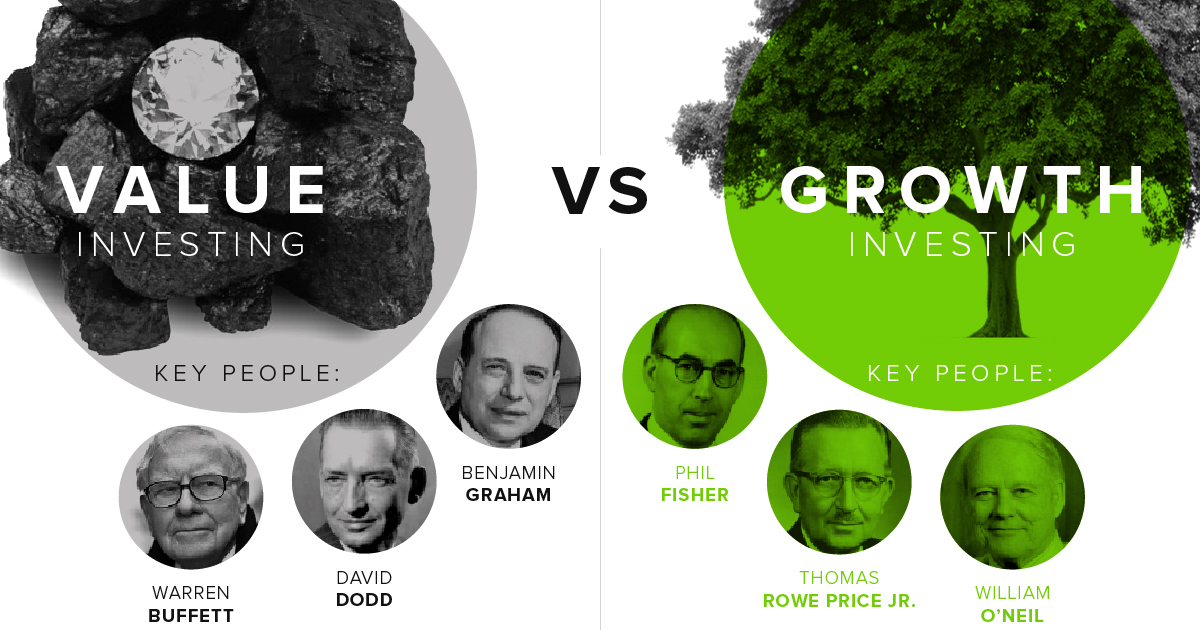
Today’s infographic comes to us from Investor’s Business Daily, and it details the basics around the discipline of growth investing, including the differences the school has with value investing. More importantly, it also provides a framework for choosing growth stocks used by elite investors such as William J. O’Neil.
Growth investing is all about identifying the companies that are exhibiting behavior that suggests that they will be tomorrow’s leaders. The benefits to this strategy, if successful, are easy to see. Think about buying Microsoft before it dominated the software industry, or Starbucks before it conquered the United States with its new approach to coffee culture. The question is: how can these stocks be found reliably?
The CAN SLIM Approach
Fantastic growth stocks don’t just grow on trees – instead, you have to have a system to sift through them. One easy place to start your search for the next growth leader is with an approach pioneered with investing legend William J. O’Neil. Developed in the 1950s, the CAN SLIM strategy identifies seven characteristics that top-performing stocks often share before making their biggest price gains. Each characteristic is represented by a letter in the CAN SLIM acronym: C – Current quarterly earnings A – Annual earnings growth N – New product, service, management, or price high S – Supply and demand L – Leader or laggard I – Institutional sponsorship M – Market direction Importantly, each of these traits can be a catalyst to influence other traits. When they compound, it can lead to big price movements that beat the rest of the market.
Breaking Down the Factors
Let’s look at each characteristic of the CAN SLIM approach in more detail: Current quarterly earnings Look for companies with a minimum earnings-per share (EPS) growth of 25% in the most recent quarter, though 50% or higher is even better. These companies should also have 20% sales growth in the quarter, and a 17% ROE to ensure that growth is sustainable. Annual earnings growth Look for companies with annual EPS growth of at least 25% to 50% in each of the previous 3-5 years. This helps confirm that the company is showing long-term growth. New product, service, management, or price high What is the company doing that is new or game-changing? To be a market winner, a company must constantly reinvent itself to position itself for higher-than-average profits. Examples: Consider Google’s monetization of search ads, or McDonald’s novel approach to food. These innovations set the companies up for massive profits and success. Supply and demand A stock price increases when more investors demand an increasingly limited supply of shares. Spikes in price, along with volume accumulation, mean that demand is increasing. If this is coming from institutional investors, who tend to buy and hold, it’s even better. Leader or laggard The leading companies in leading industries – the best of the best – will be the companies that have the most growth potential. Institutional sponsorship 75% of all market activity comes from professional investors, such as mutual funds or pension funds. Not only does the smart money help validate a potential growth stock by being involved, but they can trigger big price increases. Market direction CAN SLIM investors believe you should invest with the market, as opposed to against it. That’s because an individual stock moves with the market 75% of the time.
Putting it Together
Understanding how the different CAN SLIM factors work together – and how they can help bring massive bouts of growth for the underlying stock – is key for the successful growth investor. Using a rational system like this also helps you in overcoming cognitive biases or making other mistakes that may affect your investments, as well.
on The good news is that the Federal Reserve, U.S. Treasury, and Federal Deposit Insurance Corporation are taking action to restore confidence and take the appropriate measures to help provide stability in the market. With this in mind, the above infographic from New York Life Investments looks at the factors that impact bonds, how different types of bonds have historically performed across market environments, and the current bond market volatility in a broader context.
Bond Market Returns
Bonds had a historic year in 2022, posting one of the worst returns ever recorded. As interest rates rose at the fastest pace in 40 years, it pushed bond prices lower due to their inverse relationship. In a rare year, bonds dropped 13%.
Source: FactSet, 01/02/2023.
Bond prices are only one part of a bond’s total return—the other looks at the income a bond provides. As interest rates have increased in the last year, it has driven higher bond yields in 2023.
Source: YCharts, 3/20/2023.
With this recent performance in mind, let’s look at some other key factors that impact the bond market.
Factors Impacting Bond Markets
Interest rates play a central role in bond market dynamics. This is because they affect a bond’s price. When rates are rising, existing bonds with lower rates are less valuable and prices decline. When rates are dropping, existing bonds with higher rates are more valuable and their prices rise. In March, the Federal Reserve raised rates 25 basis points to fall within the 4.75%-5.00% range, a level not seen since September 2007. Here are projections for where the federal funds rate is headed in 2023:
Federal Reserve Projection*: 5.1% Economist Projections**: 5.3%
*Based on median estimates in the March summary of quarterly economic projections.**Projections based on March 10-15 Bloomberg economist survey. Together, interest rates and the macroenvironment can have a positive or negative effect on bonds.
Positive
Here are three variables that may affect bond prices in a positive direction:
Lower Inflation: Reduces likelihood of interest rate hikes. Lower Interest Rates: When rates are falling, bond prices are typically higher. Recession: Can prompt a cut in interest rates, boosting bond prices.
Negative
On the other hand, here are variables that may negatively impact bond prices:
Higher Inflation: Can increase the likelihood of the Federal Reserve to raise interest rates. Rising Interest Rates: Interest rate hikes lead bond prices to fall. Weaker Fundamentals: When a bond’s credit risk gets worse, its price can drop. Credit risk indicates the chance of a default, the risk of a bond issuer not making interest payments within a given time period.
Bonds have been impacted by these negative factors since inflation started rising in March 2021.
Fixed Income Opportunities
Below, we show the types of bonds that have had the best performance during rising rates and recessions.
Source: Derek Horstmeyer, George Mason University 12/3/2022. As we can see, U.S. ultrashort bonds performed the best during rising rates. Mortgage bonds outperformed during recessions, averaging 11.4% returns, but with higher volatility. U.S. long-term bonds had 7.7% average returns, the best across all market conditions. In fact, they were also a close second during recessions. When rates are rising, ultrashort bonds allow investors to capture higher rates when they mature, often with lower historical volatility.
A Closer Look at Bond Market Volatility
While bond market volatility has jumped this year, current dislocations may provide investment opportunities. Bond dislocations allow investors to buy at lower prices, factoring in that the fundamental quality of the bond remains strong. With this in mind, here are two areas of the bond market that may provide opportunities for investors:
Investment-Grade Corporate Bonds: Higher credit quality makes them potentially less vulnerable to increasing interest rates. Intermediate Bonds (2-10 Years): Allow investors to lock in higher rates.
Both types of bonds focus on quality and capturing higher yields when faced with challenging market conditions.
Finding the Upside
Much of the volatility seen in the banking sector was due to banks buying bonds during the pandemic—or even earlier—at a time when interest rates were historically low. Since then, rates have climbed considerably. Should rates moderate or stop increasing, this may present better market conditions for bonds. In this way, today’s steep discount in bond markets may present an attractive opportunity for price appreciation. At the same time, investors can potentially lock in strong yields as inflation may subside in the coming years ahead. Learn more about bond investing strategies with New York Life Investments.