Everybody loves a little competition. It levels the playing field and ensures prices and products are kept affordable and available. But how do you measure and track the competitiveness of specific sectors? The Herfindahl-Hirschman Index (HHI) is a commonly accepted measurement of market concentration, and in today’s case, we use it to show which mineral sectors have healthy competition between countries, as well as the sectors that are more monopolistic.
What is the Herfindahl-Hirschman Index?
The HHI is calculated by squaring the market share of each competitor and then summing up the resulting numbers. It can range from zero to 10,000. The closer a market is to a monopoly, the higher the market’s concentration, and the lower its competition. If there were only one company in an industry, that company would have a 100% share of the market, and the HHI would equal 10,000, demonstrating a monopoly. Conversely, if there were thousands of firms competing, the HHI would be near zero, indicating almost perfect competition.
HHI below 1,500: a competitive marketplace HHI between 1,500 – 2,500: a moderately concentrated marketplace HHI of 2,500 or greater: a highly concentrated marketplace
Interestingly, the same technique is also used by the U.S. Department of Justice to look at market competition and potential anti-trust violators, as well.
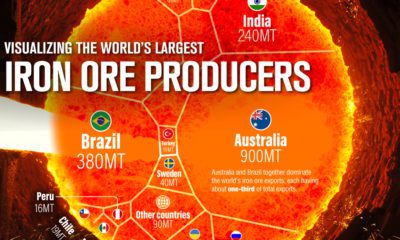
Global Metal Production
Today’s chart uses data from the World Mining Congress to look at the competition for global minerals between countries. The HHI scores show the minerals most and least exposed to competition, while uncovering opportunities for countries looking to bolster their own mineral production. Here are 33 minerals ranked, going from highest score (most monopolistic) to lowest (least monopolistic): The data here makes it clear that mineral production is not uniformly distributed throughout the world, giving some countries huge advantages while revealing potential supply problems down the road.
Renewables in the Spotlight
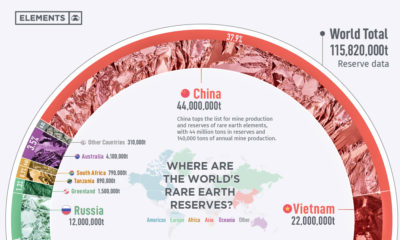
While commodities like gold and oil have robust levels of competition around the world, the renewable energy industry relies on more obscure raw materials to make solar, wind, and EVs work. Rare earth elements (REE) rank #2 on the list with a HHI score of 7,219, while battery minerals such as graphite (#6), vanadium (#8), cobalt (#10), and lithium (#16) also appear high on the list as well. According to a recent study, the production of rare earth elements is an area of particular concern. Used in everything from electric motors to wind turbines, rare earth demand will need to increase by twelve times by 2050 to reach emissions targets set by the Paris Agreement. The only problem is that China currently controls 84% of global production, which increases the odds of bottlenecks and scarcity as demand rises. This ultimately creates an interesting scenario, where a sustainable future will be at the mercy of a few a producing nations. on
#1: High Reliability
Nuclear power plants run 24/7 and are the most reliable source of sustainable energy. Nuclear electricity generation remains steady around the clock throughout the day, week, and year. Meanwhile, daily solar generation peaks in the afternoon when electricity demand is usually lower, and wind generation depends on wind speeds.As the use of variable solar and wind power increases globally, nuclear offers a stable and reliable backbone for a clean electricity grid.
#2: Clean Electricity
Nuclear reactors use fission to generate electricity without any greenhouse gas (GHG) emissions.Consequently, nuclear power is the cleanest energy source on a lifecycle basis, measured in CO2-equivalent emissions per gigawatt-hour (GWh) of electricity produced by a power plant over its lifetime. The lifecycle emissions from a typical nuclear power plant are 273 times lower than coal and 163 times lower than natural gas. Furthermore, nuclear is relatively less resource-intensive, allowing for lower supply chain emissions than wind and solar plants.
#3: Stable Affordability
Although nuclear plants can be expensive to build, they are cost-competitive in the long run. Most nuclear plants have an initial lifetime of around 40 years, after which they can continue operating with approved lifetime extensions. Nuclear plants with lifetime extensions are the cheapest sources of electricity in the United States, and 88 of the country’s 92 reactors have received approvals for 20-year extensions. Additionally, according to the World Nuclear Association, nuclear plants are relatively less susceptible to fuel price volatility than natural gas plants, allowing for stable costs of electricity generation.
#4: Energy Efficiency
Nuclear’s high energy return on investment (EROI) exemplifies its exceptional efficiency. EROI measures how many units of energy are returned for every unit invested in building and running a power plant, over its lifetime. According to a 2018 study by Weissbach et al., nuclear’s EROI is 75 units, making it the most efficient energy source by some distance, with hydropower ranking second at 35 units.
#5: Sustainable Innovation
New, advanced reactor designs are bypassing many of the difficulties faced by traditional nuclear plants, making nuclear power more accessible.
Small Modular Reactors (SMRs) are much smaller than conventional reactors and are modular—meaning that their components can be transported and assembled in different locations. Microreactors are smaller than SMRs and are designed to provide electricity in remote and small market areas. They can also serve as backup power sources during emergencies.
These reactor designs offer several advantages, including lower initial capital costs, portability, and increased scalability.
A Nuclear-Powered Future
Nuclear power is making a remarkable comeback as countries work to achieve climate goals and ultimately, a state of energy utopia. Besides the 423 reactors in operation worldwide, another 56 reactors are under construction, and at least 69 more are planned for construction. Some nations, like Japan, have also reversed their attitudes toward nuclear power, embracing it as a clean and reliable energy source for the future. CanAlaska is a leading exploration company in the Athabasca Basin, the Earth’s richest uranium depository. Click here to learn more now. In part 3 of the Road to Energy Utopia series, we explore the unique properties of uranium, the fuel that powers nuclear reactors.