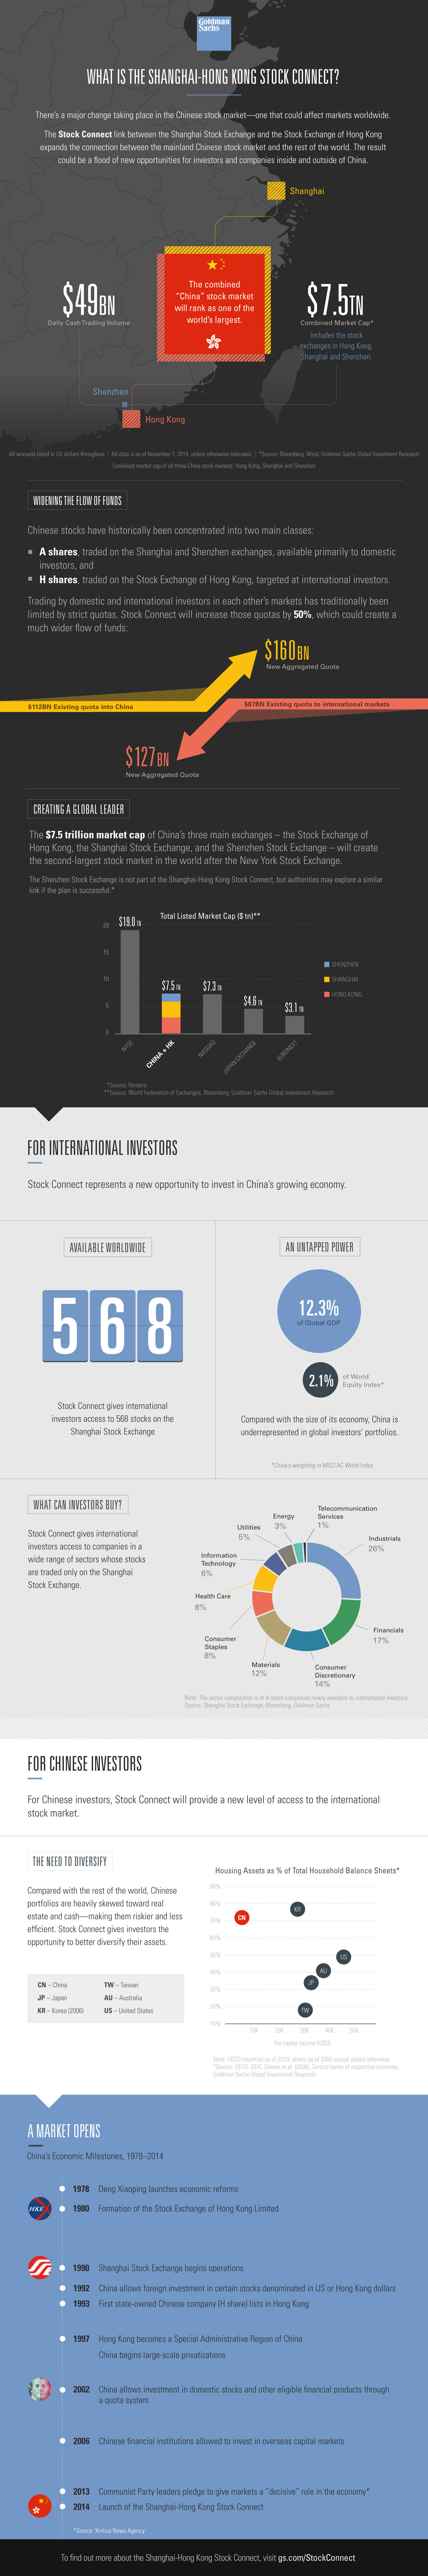
What is the Shanghai-Hong Kong Stock Connect?
On November 17th, the long awaited Shanghai-Hong Kong Stock Connect launched, connecting Mainland China’s capital markets with Hong Kong in a way never seen before. Before the new investment channel link, individual investors could only participate indirectly in financial securities in the Mainland, such as specific funds and ETFs. The Shanghai-Hong Kong Stock Connect, however, now allows investors to trade securities in a range of listed stocks in each both markets through their respective securities companies. This helps to promote and strengthen the connection between the two markets. There is still a big disconnect between dual-listed companies traded in both Shanghai and Hong Kong. Some expected deeply discounted shares trading in Hong Kong to converge with their corresponding values on the Mainland. However, it is also true that shares are not directly fungible, which means that arbitrage is not possible. It is expected that the Shenzhen Exchange will follow suit in the future if the Stock Connect is deemed successful. With all three merged, it would create the 2nd largest exchange in the world with a market capitalization of $7.5 trillion. While not yet passing the NYSE in value, the combined exchange would be bigger than the NASDAQ which has a market capitalization of $7.3 trillion. Original graphic from: Goldman Sachs
Other Infographics
on Last year, stock and bond returns tumbled after the Federal Reserve hiked interest rates at the fastest speed in 40 years. It was the first time in decades that both asset classes posted negative annual investment returns in tandem. Over four decades, this has happened 2.4% of the time across any 12-month rolling period. To look at how various stock and bond asset allocations have performed over history—and their broader correlations—the above graphic charts their best, worst, and average returns, using data from Vanguard.
How Has Asset Allocation Impacted Returns?
Based on data between 1926 and 2019, the table below looks at the spectrum of market returns of different asset allocations:
We can see that a portfolio made entirely of stocks returned 10.3% on average, the highest across all asset allocations. Of course, this came with wider return variance, hitting an annual low of -43% and a high of 54%.
A traditional 60/40 portfolio—which has lost its luster in recent years as low interest rates have led to lower bond returns—saw an average historical return of 8.8%. As interest rates have climbed in recent years, this may widen its appeal once again as bond returns may rise.
Meanwhile, a 100% bond portfolio averaged 5.3% in annual returns over the period. Bonds typically serve as a hedge against portfolio losses thanks to their typically negative historical correlation to stocks.
A Closer Look at Historical Correlations
To understand how 2022 was an outlier in terms of asset correlations we can look at the graphic below:
The last time stocks and bonds moved together in a negative direction was in 1969. At the time, inflation was accelerating and the Fed was hiking interest rates to cool rising costs. In fact, historically, when inflation surges, stocks and bonds have often moved in similar directions. Underscoring this divergence is real interest rate volatility. When real interest rates are a driving force in the market, as we have seen in the last year, it hurts both stock and bond returns. This is because higher interest rates can reduce the future cash flows of these investments. Adding another layer is the level of risk appetite among investors. When the economic outlook is uncertain and interest rate volatility is high, investors are more likely to take risk off their portfolios and demand higher returns for taking on higher risk. This can push down equity and bond prices. On the other hand, if the economic outlook is positive, investors may be willing to take on more risk, in turn potentially boosting equity prices.
Current Investment Returns in Context
Today, financial markets are seeing sharp swings as the ripple effects of higher interest rates are sinking in. For investors, historical data provides insight on long-term asset allocation trends. Over the last century, cycles of high interest rates have come and gone. Both equity and bond investment returns have been resilient for investors who stay the course.