Today’s visualization is the summary of energy consumption for 2017, but you can see previous years going all the way back to 2010 on their website.
Dealing in Quads
The first thing you’ll notice about this Sankey is that it uses an unfamiliar unit of measurement: the quad. Each quad is equal to a quadrillion BTUs, and it’s roughly comparable to the following:
8,007,000,000 gallons (US) of gasoline 293,071,000,000 kilowatt-hours (kWh) 36,000,000 tonnes of coal 970,434,000,000 cubic feet of natural gas 25,200,000 tonnes of oil 252,000,000 tonnes of TNT 13.3 tonnes of uranium-235
Put another way, a quad is a massive unit that only is useful in measuring something like national energy consumption – and in this case, the total amount of energy used by the country was 97.7 quadrillion BTUs.
Energy Wasted
On the diagram, one thing that is immediately noticeable is that a whopping 68% of all energy is actually rejected energy, or energy that gets wasted through various inefficiencies. It’s quite eye-opening to look at this data sorted by sector: The transportation sector used 28.1 quads of energy in 2017, about 28.8% of the total consumption. However, it wasted 22.2 quads of that energy with its poor efficiency rate, which made for more rejected energy than the other three sectors combined. This wastage and inefficiency in the transportation sector provides an interesting lens from which to view the green energy revolution, and it also helps explain the vision that Elon Musk has for the future of Tesla.
A Ways to Go
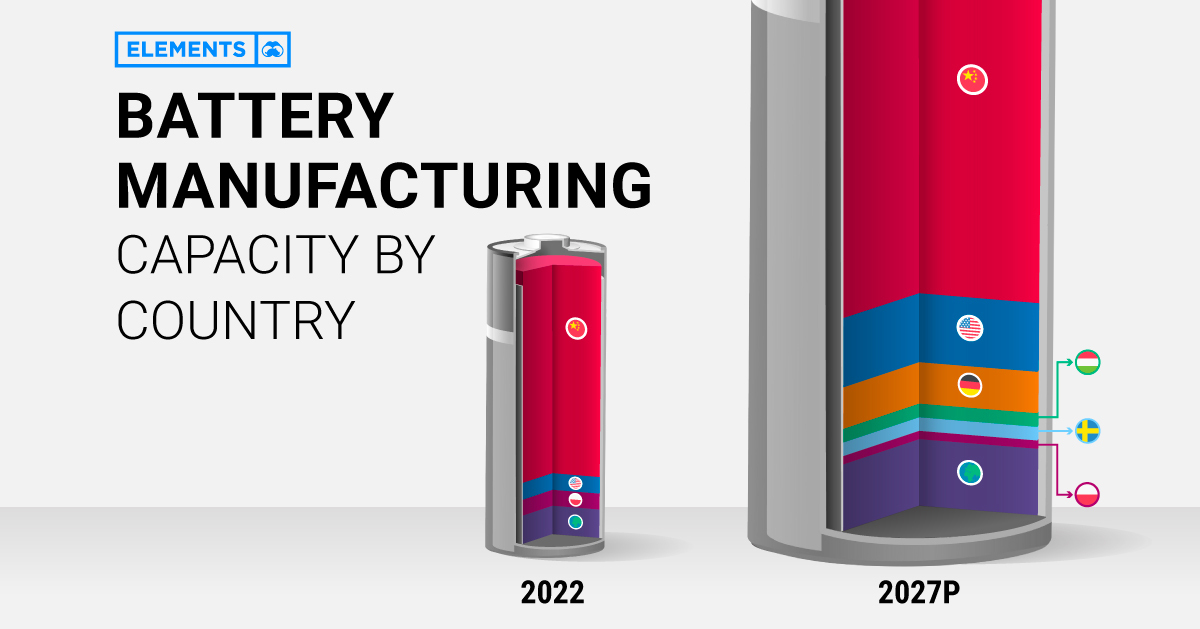
The last time we posted a version of this visualization was for the 2015 edition of the diagram, and we noted that renewables had a ways to go as a factor in the whole energy mix. Here are how things have changed over the last two years: As you can see, solar and wind consumption are jumping considerably – but in absolute terms, our note from two years ago still remains true. To make the desired impact, renewable energy still has a ways to go. on With the world gearing up for the electric vehicle era, battery manufacturing has become a priority for many nations, including the United States. However, having entered the race for batteries early, China is far and away in the lead. Using the data and projections behind BloombergNEF’s lithium-ion supply chain rankings, this infographic visualizes battery manufacturing capacity by country in 2022 and 2027p, highlighting the extent of China’s battery dominance.
Battery Manufacturing Capacity by Country in 2022
In 2022, China had more battery production capacity than the rest of the world combined. With nearly 900 gigawatt-hours of manufacturing capacity or 77% of the global total, China is home to six of the world’s 10 biggest battery makers. Behind China’s battery dominance is its vertical integration across the rest of the EV supply chain, from mining the metals to producing the EVs. It’s also the largest EV market, accounting for 52% of global sales in 2021. Poland ranks second with less than one-tenth of China’s capacity. In addition, it hosts LG Energy Solution’s Wroclaw gigafactory, the largest of its kind in Europe and one of the largest in the world. Overall, European countries (including non-EU members) made up just 14% of global battery manufacturing capacity in 2022. Although it lives in China’s shadow when it comes to batteries, the U.S. is also among the world’s lithium-ion powerhouses. As of 2022, it had eight major operational battery factories, concentrated in the Midwest and the South.
China’s Near-Monopoly Continues Through 2027
Global lithium-ion manufacturing capacity is projected to increase eightfold in the next five years. Here are the top 10 countries by projected battery production capacity in 2027: China’s well-established advantage is set to continue through 2027, with 69% of the world’s battery manufacturing capacity. Meanwhile, the U.S. is projected to increase its capacity by more than 10-fold in the next five years. EV tax credits in the Inflation Reduction Act are likely to incentivize battery manufacturing by rewarding EVs made with domestic materials. Alongside Ford and General Motors, Asian companies including Toyota, SK Innovation, and LG Energy Solution have all announced investments in U.S. battery manufacturing in recent months. Europe will host six of the projected top 10 countries for battery production in 2027. Europe’s current and future battery plants come from a mix of domestic and foreign firms, including Germany’s Volkswagen, China’s CATL, and South Korea’s SK Innovation.
Can Countries Cut Ties With China?
Regardless of the growth in North America and Europe, China’s dominance is unmatched. Battery manufacturing is just one piece of the puzzle, albeit a major one. Most of the parts and metals that make up a battery—like battery-grade lithium, electrolytes, separators, cathodes, and anodes—are primarily made in China. Therefore, combating China’s dominance will be expensive. According to Bloomberg, the U.S. and Europe will have to invest $87 billion and $102 billion, respectively, to meet domestic battery demand with fully local supply chains by 2030.