As people moved in and out of certain areas for both lifestyle and economic reasons, which U.S. state populations fluctuated the most? Drawing from the latest Census Bureau data, we look at how each state’s resident populations evolved over the past decade. But first, a blast from the past.
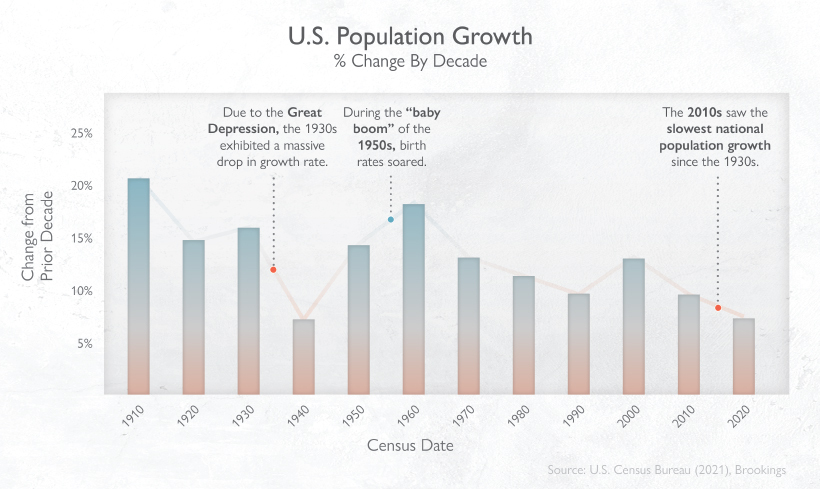
Historical Trends: U.S. Population Since the 1930s
Population growth trends in the U.S. have been closely tied to the economic ebbs and flows experienced by the nation. In one stark example, the country’s 10-year population growth rate plummeted to just 7.3% due to the Great Depression.
This was later offset by the post-WWII “Baby Boom”, during which birth rates soared once more, bumping up the population 10-year growth rate to 18.5% in the 1950s. The Baby Boomer generation now wields the most influence over the U.S. economy and society thanks to the favorable economic conditions in which they were born. However, U.S. population growth rates recently hit new lows—the slower pace in the 2010s is rivalling that of the 1930s. According to Brookings, there area few factors at play:
Falling fertility rate An increase in deaths (aging population, overdose deaths) Lower immigration rate
With all this in mind, how does the current landscape of the U.S. population by state look?
The Entire U.S. Population by State in 2020
The U.S. experienced 7.4% population growth between 2010-2020, which equates to the addition of 22.7 million people. An impressive one-tenth of this growth occurred in California, and it remains the most populous state, rising above 39.5 million people in 2020. The SoCal megaregion—Los Angeles and San Diego—alone contributes more than $1.4 trillion to global economic output. *Note: U.S. total and 10-year percentage change includes District of Columbia but excludes Puerto Rico Overall, there’s been a significant shift in population towards the Sun Belt region (stretching from Southeast to Southwest), where 62% of the U.S. now resides. Let’s take a closer look at the biggest gainers and decliners over time.
Gainers: Utah, Texas
Utah saw the quickest population growth rate of 18.4% in the last decade. Drawn in by strong economic prospects, net migration into the state is balancing out a decline in births. What’s interesting is that 80% of Utah’s population is concentrated in the Wasatch Front – a metro area anchored by Salt Lake City and the chain of cities and towns running north and south of Utah’s largest city. A little further south, Texas swelled by almost 4 million residents in the last 10 years. Much of this growth took place in the “Texas Triangle”, which contains Dallas, Houston, San Antonio, and Austin. This booming region of the country contributes over $1.2 trillion to global economic output.
Decliners: West Virginia, Puerto Rico
West Virginia lost the most people in a decade, seeing a numeric population decline of 59,278. This may be explained by an aging population—16% of West Virginians are 65 years old and above. When territories are also taken into account, Puerto Rico saw the biggest percentage decline of 11.8%, or close to 44,000 people over 10 years. Many of them moved into the mainland, and especially into Florida, after two hurricanes hit the island in 2017.
Full Speed Ahead: States Competing On Forward Momentum
By 2025, California will be home to five of the fastest-growing urban U.S. cities. The unstoppable growth of the tech industry in Silicon Valley is partly behind this, as many people flock to the West Coast to fill the shoes of highly skilled jobs required. But could Silicon Valley one day lose its steam? Current and projected population growth in Texas is bolstering its tech potential too—in fact, it’s been dubbed the next “Silicon Hills”, with many tech companies from SpaceX to Oracle choosing to camp out in Austin instead. on Are wealth and prosperity legitimate measures of happiness? How about safety and health outcomes? In the West, we view democracy as a key component to happiness, yet there are countries under authoritarian rule that score high in the Happiness Index. Questions like these make “ranking happiness” a particularly challenging puzzle, but also one worth pursuing. If policymakers have a clearer picture of what conditions can foster happiness, they can enact policies that can improve the lives of people living their jurisdictions. The map above is a global snapshot of life satisfaction around the world. It utilizes the World Happiness Report—an annual survey of how satisfied citizens are worldwide—to map out the world’s happiest and least happy countries. To create the index the map is based on, researchers simply asked people how satisfied they are with their lives. Scores were assigned using these self-reported answers from people living within various countries, as well as quality of life factors. While there may be no perfect measure of happiness around the world, the report is a robust and transparent attempt to understand happiness at the global level. For more detailed notes on the report’s methodology and more, we recommend viewing the info box at the end of this article. Now, let’s look at the world’s happiest countries in 2023.
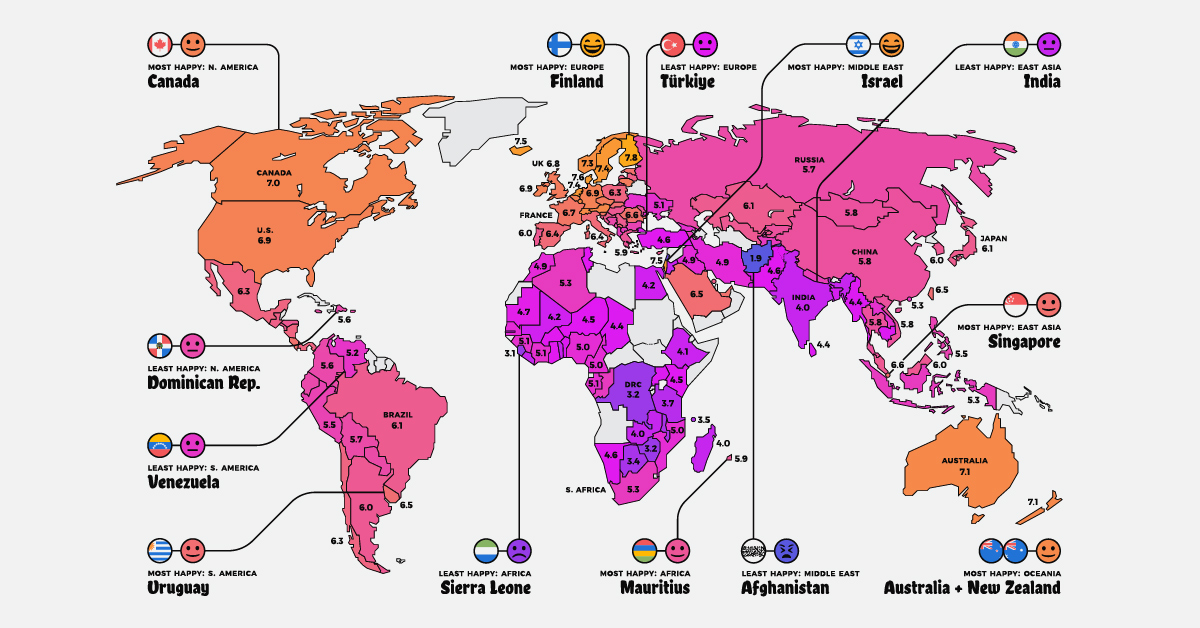
Global Happiness, by Country
Global happiness currently averages out to 5.5 out of 10, a decrease of 0.1 from last year. Below is a look at every country’s score: Note: Scores have been rounded to the first decimal place. European countries make up the bulk of the top 10, with Israel (#4) and New Zealand (#10) also making it into the top ranks. Finland sits at the very top of the ranking for the sixth year in a row. Now let’s look at the world’s happiest countries on a more regional basis.
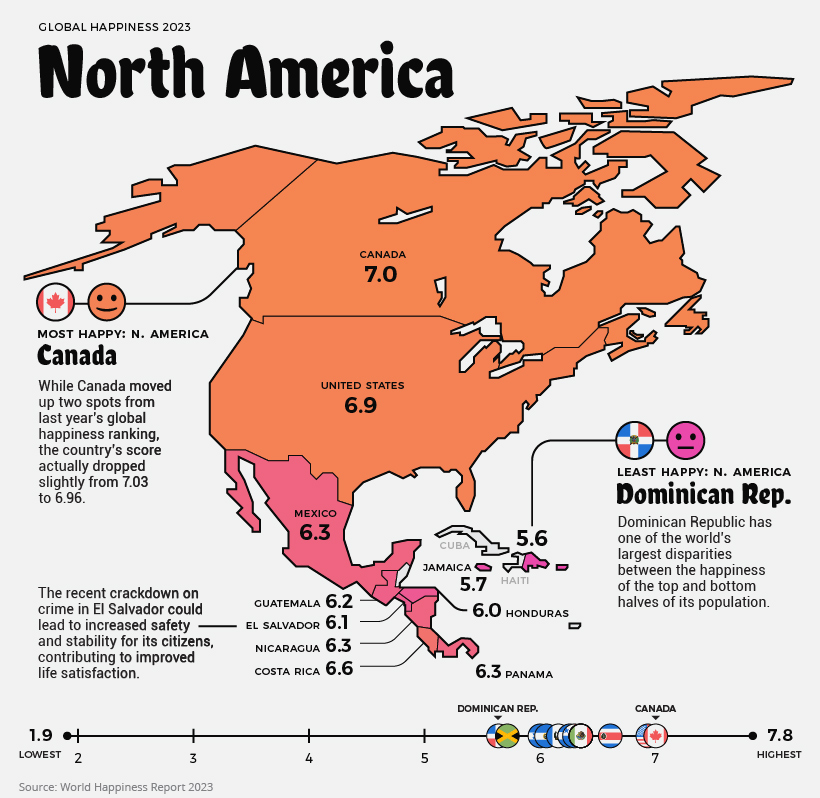
North America
Current Mood: Happy (6.3)
North America’s happiness score averages out to 6.3/10. The happiest country in the region is Canada, slightly beating out the United States. However, the scores of both countries have actually decreased from last year. It’s difficult to pinpoint why citizens feel less satisfied, but inflation, economic uncertainty, and many other factors could play a role. The only countries to see improvement in North America were Nicaragua and Jamaica. Although a more recent development, many Jamaicans could be experiencing even more happiness in the near future, with a recent announcement of plans to increase the minimum wage by 44%.
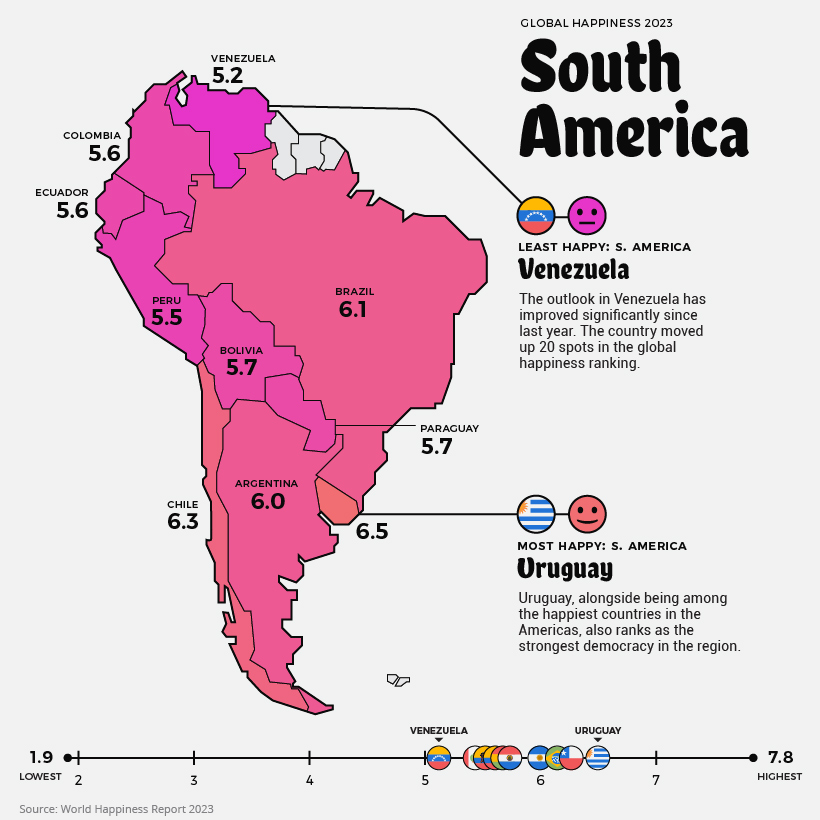
South America
Current Mood: Content (5.8)
South America’s average score is 5.8. Although Venezuela is the continent’s least happy country, its score actually improved from 4.9 to 5.2. That said, the ongoing humanitarian and economic crisis is not likely to instill much hope into the average Venezuelan. Over 6.8 million people have fled the struggling nation since 2014. The two countries in the region with decreased scores were Brazil and Colombia, where citizens have reported feeling worse compared to the year before.
Europe
Current Mood: Happy (6.4)
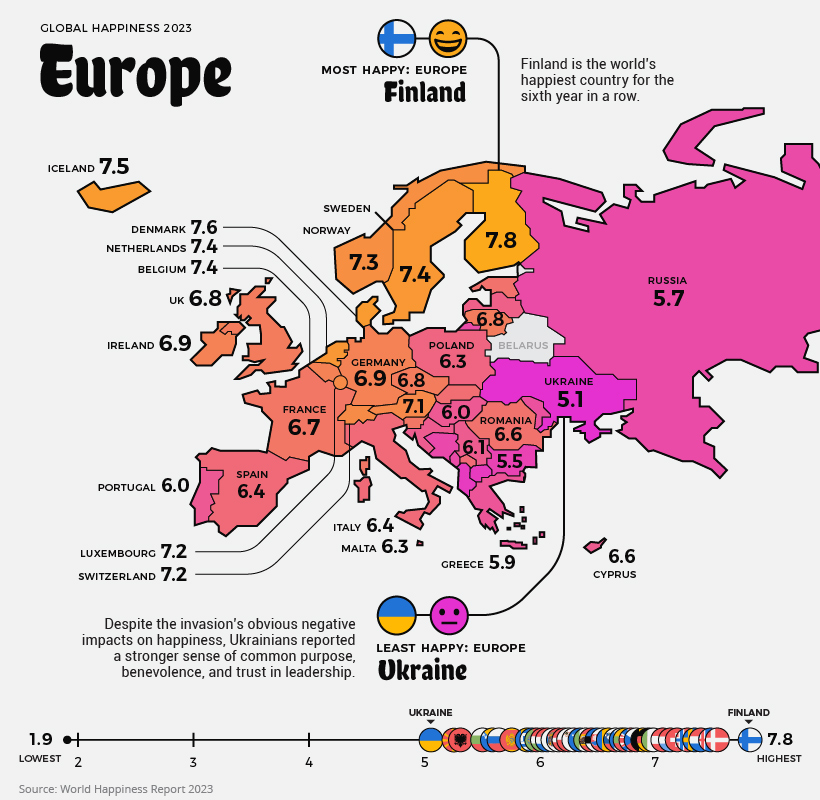
Europe has some of the world’s happiest countries, with an average regional score of 6.4. Nordic countries like Finland, Sweden, and Iceland repeatedly report high scores, meaning people in these countries feel extremely satisfied with their lives.
Despite fending off an invasion, Ukrainians saw no diminishment of their happiness year-over-year, and many are feeling resilient and purposeful in their fight for freedom. Interestingly, Russia’s score actually increased slightly compared to last year, going from 5.5 to 5.7.
East Asia and Oceania
Current Mood: Neutral (5.6)
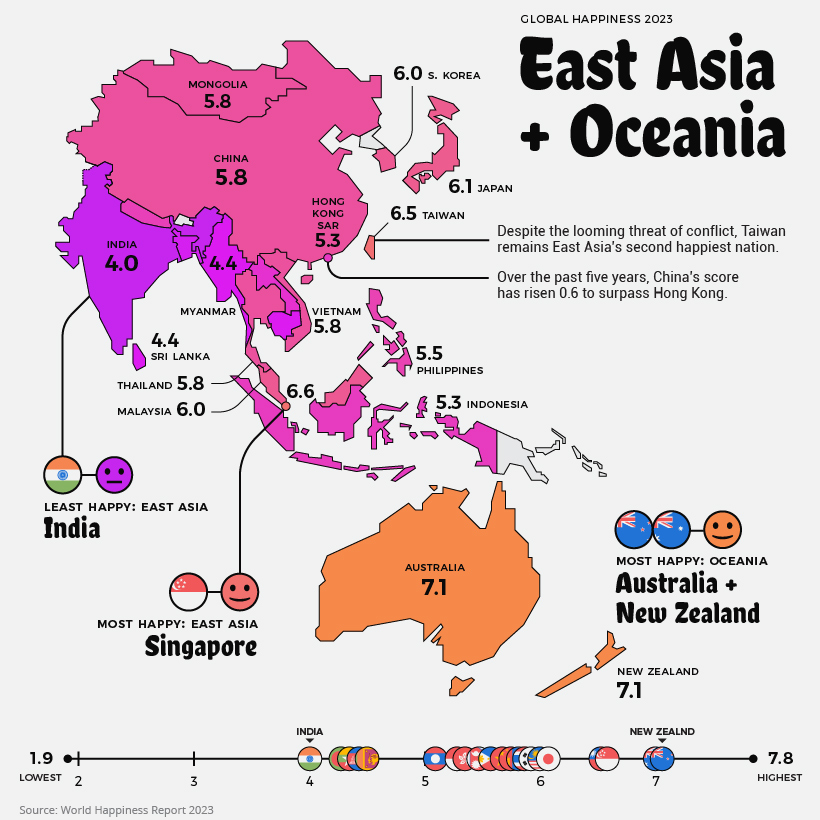
East Asia and Oceania’s collective average is 5.6. Oceania alone, however, would have the highest regional score in the world, at 7.1. Bucking conventional wisdom—at least in the West—China has seen a noteworthy bump (+0.6) in its score in recent years. Across the strait, Taiwan records the second highest score in East Asia, after Singapore. India once again has the lowest happiness score in its region. The country’s score has dropped -0.7 over the past decade.
Central Asia and The Middle East
Current Mood: It’s Complicated (5.2)
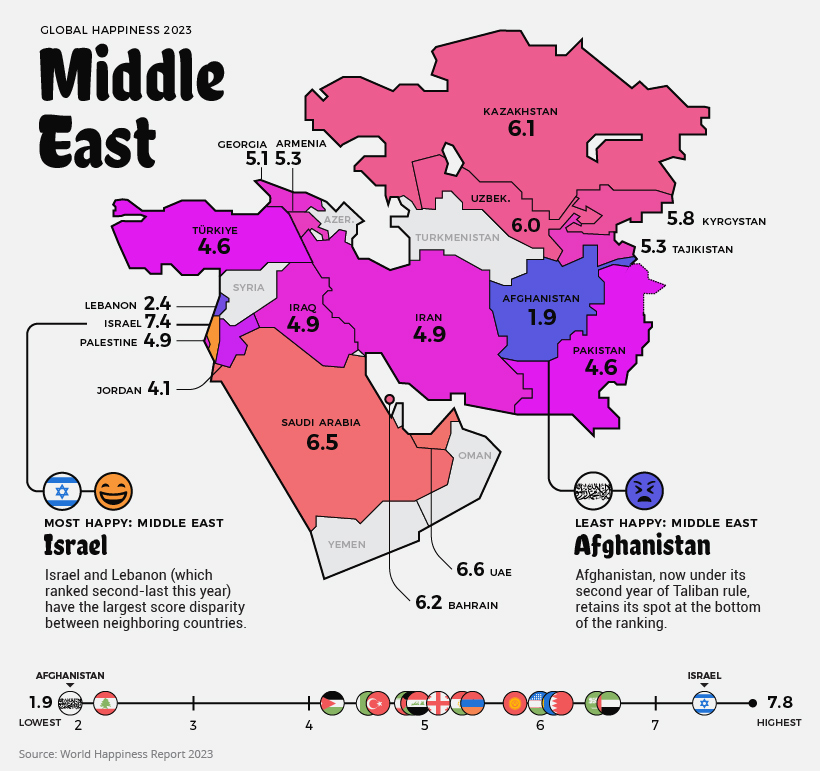
The average score in the Middle East and Central Asia is 5.2, and the array of happiness scores is wider than in any other region. Afghanistan is the world’s least happy country, with citizens having reported extremely low levels of life satisfaction. Since the Taliban takeover, life has become objectively worse for Afghans, particularly women. There is a lot of conflict in the region. Citizens of Armenia face particular tension with neighboring Azerbaijan, whose score was not recorded for this year. Conflicts in the Nagorno-Karabakh region have led to hundreds of deaths since 2020 and cause daily struggle for those who live in the disputed territory. Iran is still under economic sanctions and faces ongoing tensions with the U.S. and Israel. Some countries, like Syria and Yemen, are so destabilized that no data is available. Still, there are bright spots as well. Israel has one of the world’s happiest countries with a top 10 score this year, and Saudi Arabia and the UAE have scores on par with many European countries.
Africa
Current Mood: Unhappy (4.4)
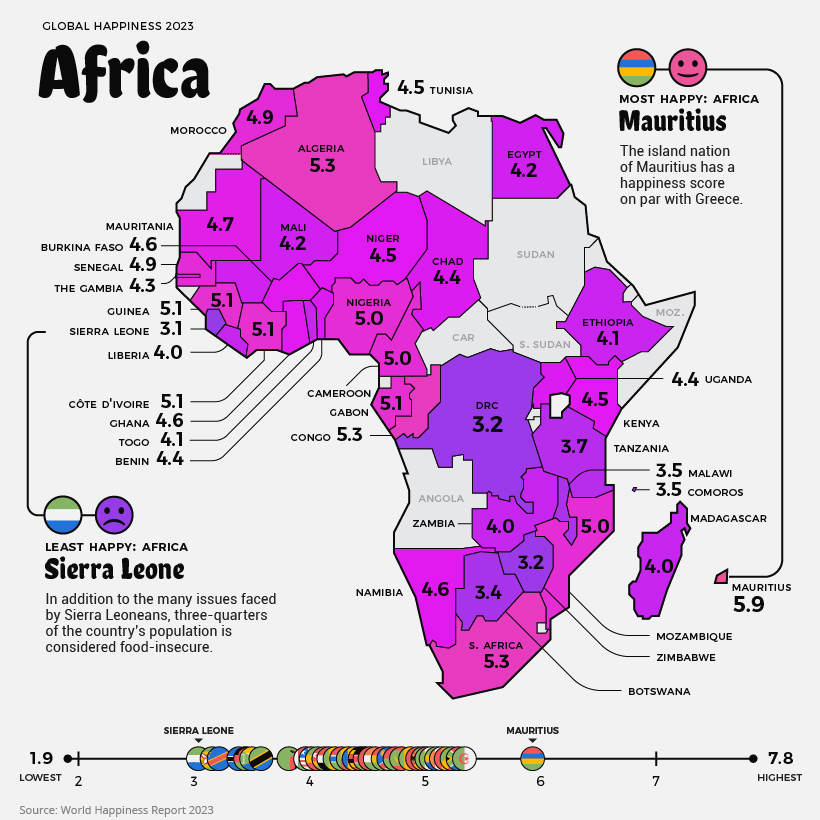
The least happy region, Africa, averages out to a score of 4.4, and there is a lot of regional variation. The highest score in Africa goes to the island nation of Mauritius. In addition to the country’s natural beauty and stability, there is growing economic opportunity. Mauritius is classified as an upper-middle-income country by World Bank, and is one of the fastest growing high-income markets in the world. Sierra Leone has the lowest score of African countries that were included in the index, followed by Zimbabwe and the Democratic Republic of the Congo. It’s worth noting, there are a few data gaps in the region, including Burundi, which is currently the poorest country in the world. Source: The World Happiness Report which leverages data from the Gallup World Poll. Methodology: A nationally representative group of approximately 1,000 people is asked a series of questions relating to their life satisfaction, as well as positive and negative emotions they are experiencing. The life evaluation question is based on the Cantril ladder, wherein the top of the ladder represents the best possible life for a person (a score of 10/10) and on the flipside, the worst possible life (scored as 0/10). The main takeaway is that the scores result from self-reported answers by citizens of each of these countries. The results received a confidence interval of 95%, meaning that there is a 95% chance that the answers and population surveyed represent the average. As well, scores are averaged over the past three years in order to increase the sample size of respondents in each country. Criticisms: Critics of the World Happiness Report point out that survey questions measure satisfaction with socioeconomic conditions as opposed to individual emotional happiness. As well, there are myriad cultural differences around the world that influence how people think about happiness and life satisfaction. Finally, there can be big differences in life satisfaction between groups within a country, which are averaged out even in a nationally representative group. The report does acknowledge inequality as a factor by measuring the “gap” between the most and least happy halves of each country.