The world is adopting renewable energy at an unprecedented pace, and solar power is the energy source leading the way. Despite a 4.5% fall in global energy demand in 2020, renewable energy technologies showed promising progress. While the growth in renewables was strong across the board, solar power led from the front with 127 gigawatts installed in 2020, its largest-ever annual capacity expansion. The above infographic uses data from the International Renewable Energy Agency (IRENA) to map solar power capacity by country in 2021. This includes both solar photovoltaic (PV) and concentrated solar power capacity.
The Solar Power Leaderboard
From the Americas to Oceania, countries in virtually every continent (except Antarctica) added more solar to their mix last year. Here’s a snapshot of solar power capacity by country at the beginning of 2021: *1 megawatt = 1,000,000 watts. China is the undisputed leader in solar installations, with over 35% of global capacity. What’s more, the country is showing no signs of slowing down. It has the world’s largest wind and solar project in the pipeline, which could add another 400,000MW to its clean energy capacity. Following China from afar is the U.S., which recently surpassed 100,000MW of solar power capacity after installing another 50,000MW in the first three months of 2021. Annual solar growth in the U.S. has averaged an impressive 42% over the last decade. Policies like the solar investment tax credit, which offers a 26% tax credit on residential and commercial solar systems, have helped propel the industry forward. Although Australia hosts a fraction of China’s solar capacity, it tops the per capita rankings due to its relatively low population of 26 million people. The Australian continent receives the highest amount of solar radiation of any continent, and over 30% of Australian households now have rooftop solar PV systems.
China: The Solar Champion
In 2020, President Xi Jinping stated that China aims to be carbon neutral by 2060, and the country is taking steps to get there. China is a leader in the solar industry, and it seems to have cracked the code for the entire solar supply chain. In 2019, Chinese firms produced 66% of the world’s polysilicon, the initial building block of silicon-based photovoltaic (PV) panels. Furthermore, more than three-quarters of solar cells came from China, along with 72% of the world’s PV panels. With that said, it’s no surprise that 5 of the world’s 10 largest solar parks are in China, and it will likely continue to build more as it transitions to carbon neutrality.
What’s Driving the Rush for Solar Power?
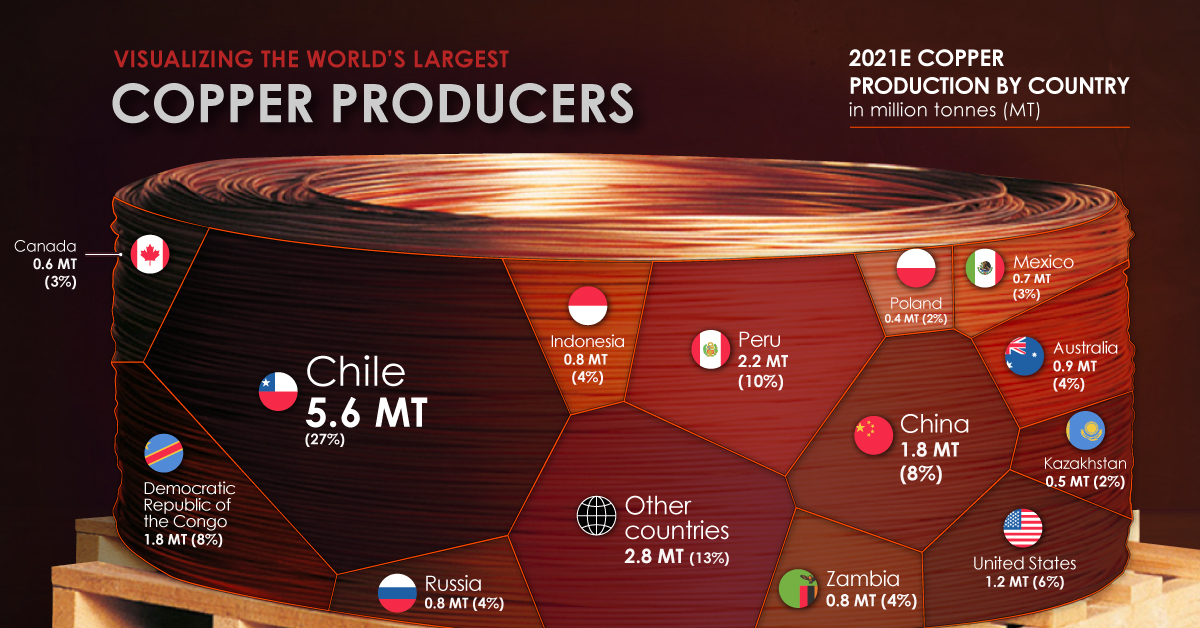
The energy transition is a major factor in the rise of renewables, but solar’s growth is partly due to how cheap it has become over time. Solar energy costs have fallen exponentially over the last decade, and it’s now the cheapest source of new energy generation. Since 2010, the cost of solar power has seen a 85% decrease, down from $0.28 to $0.04 per kWh. According to MIT researchers, economies of scale have been the single-largest factor in continuing the cost decline for the last decade. In other words, as the world installed and made more solar panels, production became cheaper and more efficient. This year, solar costs are rising due to supply chain issues, but the rise is likely to be temporary as bottlenecks resolve. on Man has relied on copper since prehistoric times. It is a major industrial metal with many applications due to its high ductility, malleability, and electrical conductivity. Many new technologies critical to fighting climate change, like solar panels and wind turbines, rely on the red metal. But where does the copper we use come from? Using the U.S. Geological Survey’s data, the above infographic lists the world’s largest copper producing countries in 2021.
The Countries Producing the World’s Copper
Many everyday products depend on minerals, including mobile phones, laptops, homes, and automobiles. Incredibly, every American requires 12 pounds of copper each year to maintain their standard of living. North, South, and Central America dominate copper production, as these regions collectively host 15 of the 20 largest copper mines. Chile is the top copper producer in the world, with 27% of global copper production. In addition, the country is home to the two largest mines in the world, Escondida and Collahuasi. Chile is followed by another South American country, Peru, responsible for 10% of global production. The Democratic Republic of Congo (DRC) and China share third place, with 8% of global production each. Along with being a top producer, China also consumes 54% of the world’s refined copper.
Copper’s Role in the Green Economy
Technologies critical to the energy transition, such as EVs, batteries, solar panels, and wind turbines require much more copper than conventional fossil fuel based counterparts. For example, copper usage in EVs is up to four times more than in conventional cars. According to the Copper Alliance, renewable energy systems can require up to 12x more copper compared to traditional energy systems. With these technologies’ rapid and large-scale deployment, copper demand from the energy transition is expected to increase by nearly 600% by 2030. As the transition to renewable energy and electrification speeds up, so will the pressure for more copper mines to come online.