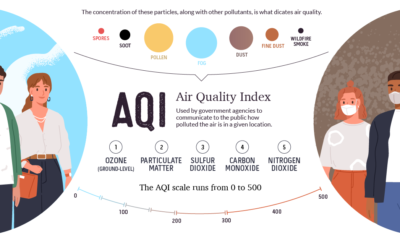
In many parts of the world, blue skies are a rarity. Instead, accumulated levels of air pollution from industrial processes and motor vehicle traffic cloak cities in smog year-round. But to what extent does air pollution impact the human population around the world? To answer this question, data scientist Matt Dzugan has created a cartogram that shades each country based on levels of fine particulate matter (PM2.5) air pollution experienced by the population living there.
Carto-What?
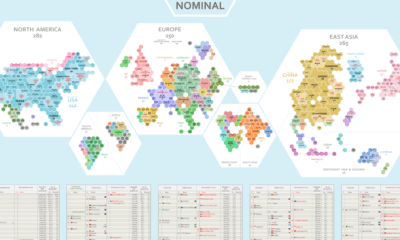
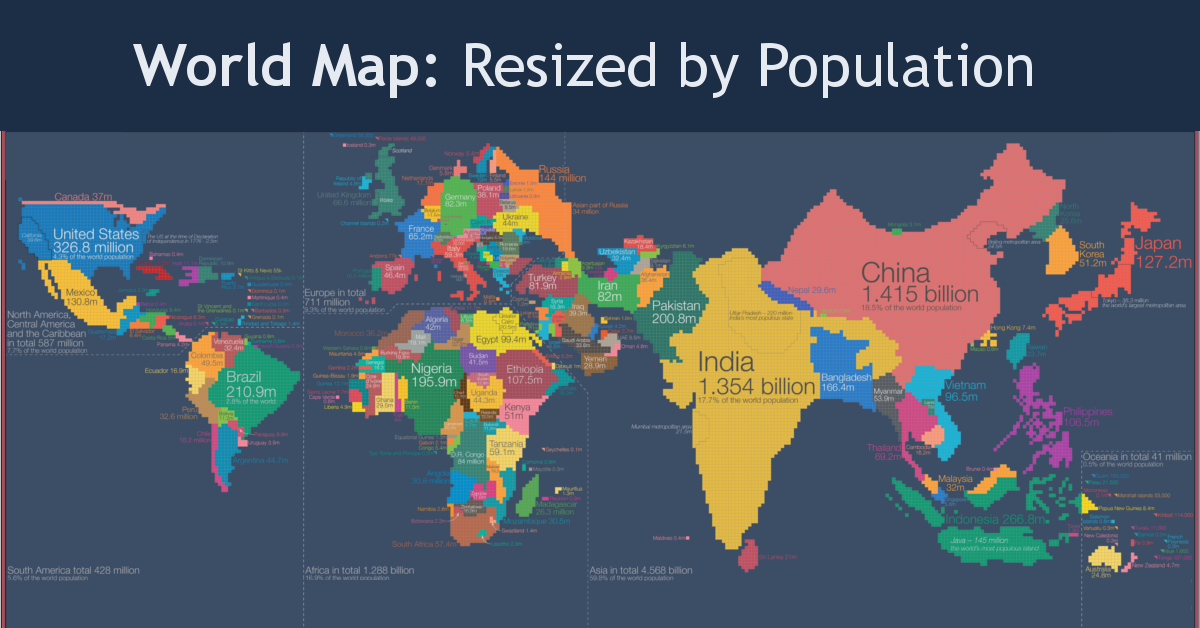
First off, let’s talk about the visualization style itself. Not your everyday map, this unconventional cartogram resizes the borders of countries based on their total populations. In this style, a single square represents 500,000 people. According to Matt Dzugan, the cartogram view is meant to provide a bird’s eye perspective of the impact of air pollution and fine particulate matter (PM2.5) on human lives. A clear correlation emerges: some of the most inhabited places in the world also experience the most pollution. Highly populated China and India show up the most prominently, while other countries like Australia and Canada seem to disappear off the map entirely. To put this into perspective, 800 dark brown squares on this cartogram (a PM2.5 concentration of 50 μg/m³) represent 400 million people in India that are exposed to polluted air at levels five times past thresholds set by the World Health Organization.
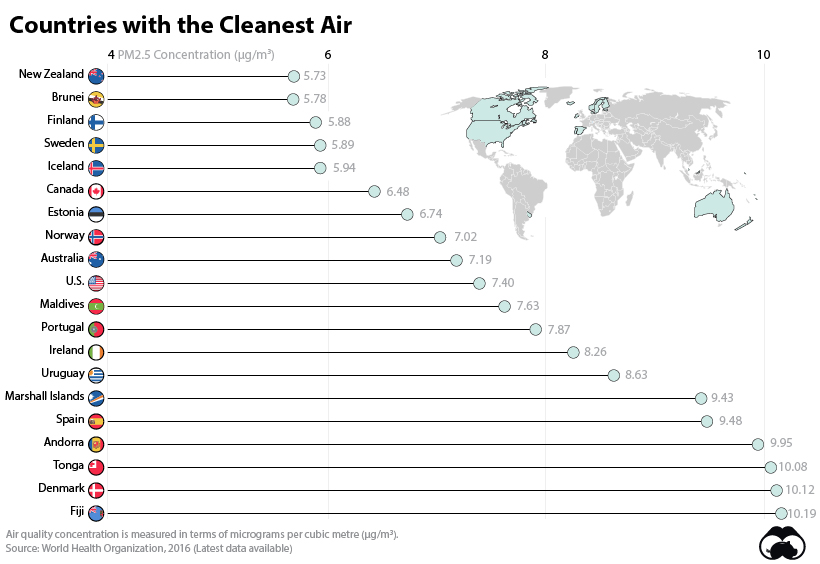
Top 20 Countries with Cleanest Air
So how do countries on each end of the PM2.5 spectrum shake out? Pulling supplemental data from the WHO, here’s how the top 20 countries with the cleanest air rank.
New Zealand tops the above list. And as you can see, air quality tends to be highest in advanced coastal economies with low population densities—and being an island or bordering less habitable Arctic tundra also helps as well. That said, there are temporary bouts when air quality can dip in even the best of countries. For example, recent wildfires on the West Coast of the United States and Australia resulted in reddish-orange skies and hazardous levels of air quality for weeks at a time.
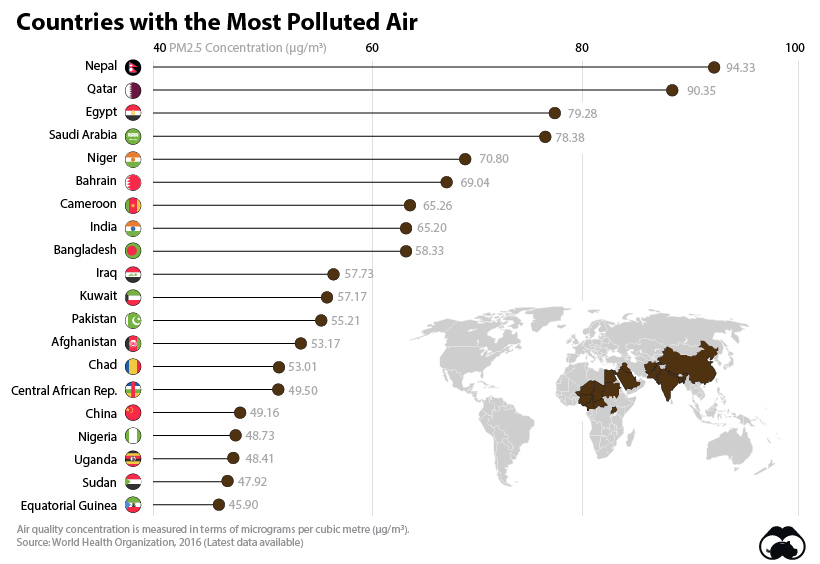
The 20 Countries with the Most Air Pollution
On the other hand, it may be surprising that Nepal lands all the way at the bottom of the air quality list. Why is this landlocked country—home to less than 30 million—suffering from hazardous air pollution reaching 100μg/m³? In short, the emissions from fossil-fuel driven traffic and manufacturing operations are trapped within the Kathmandu valley, which causes air quality issues for people living in the region.
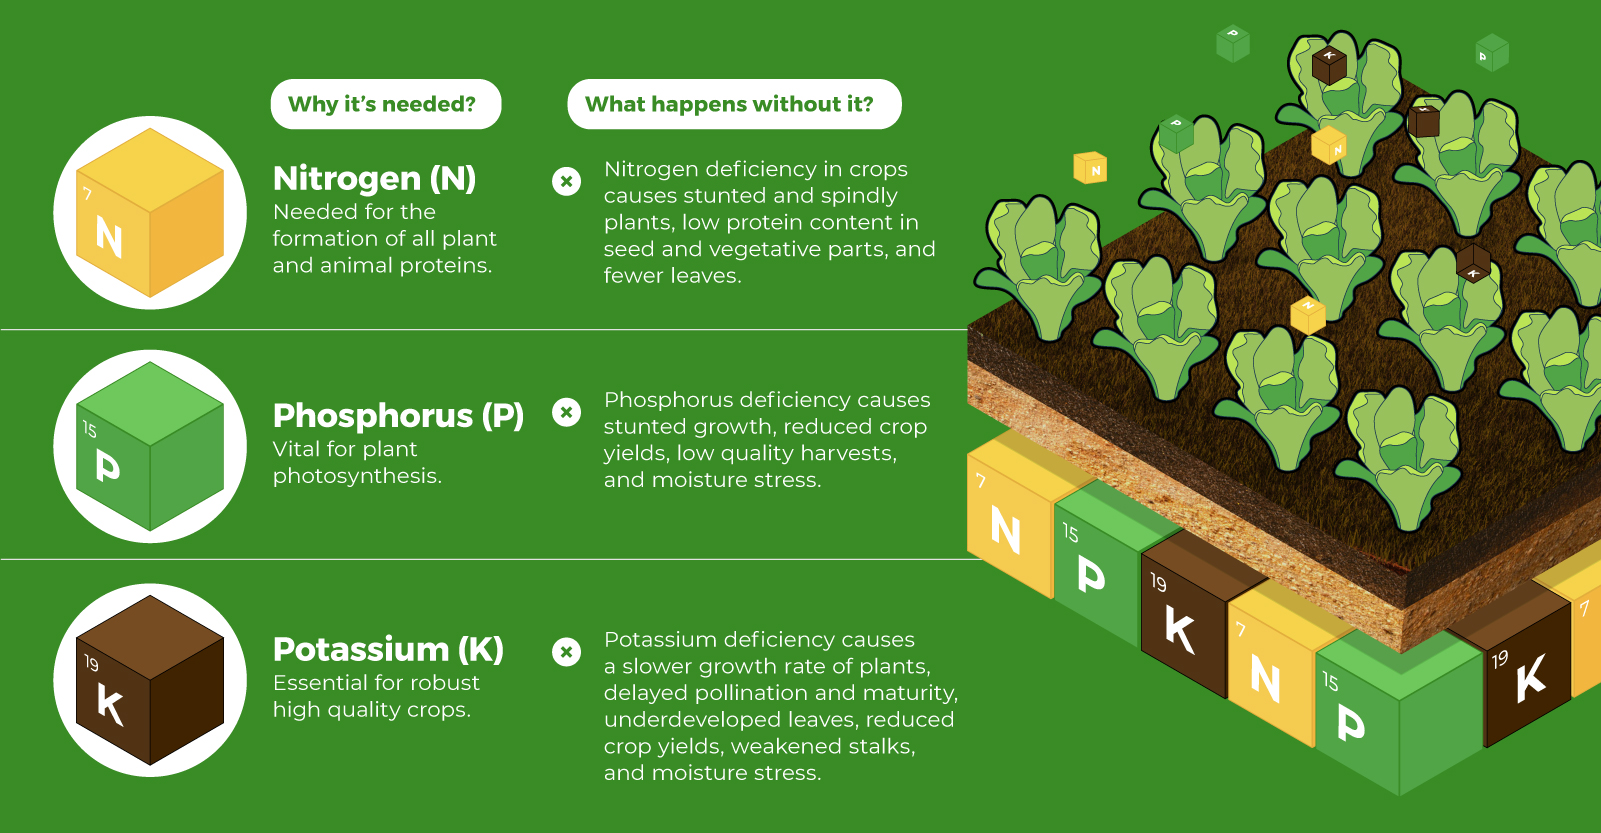
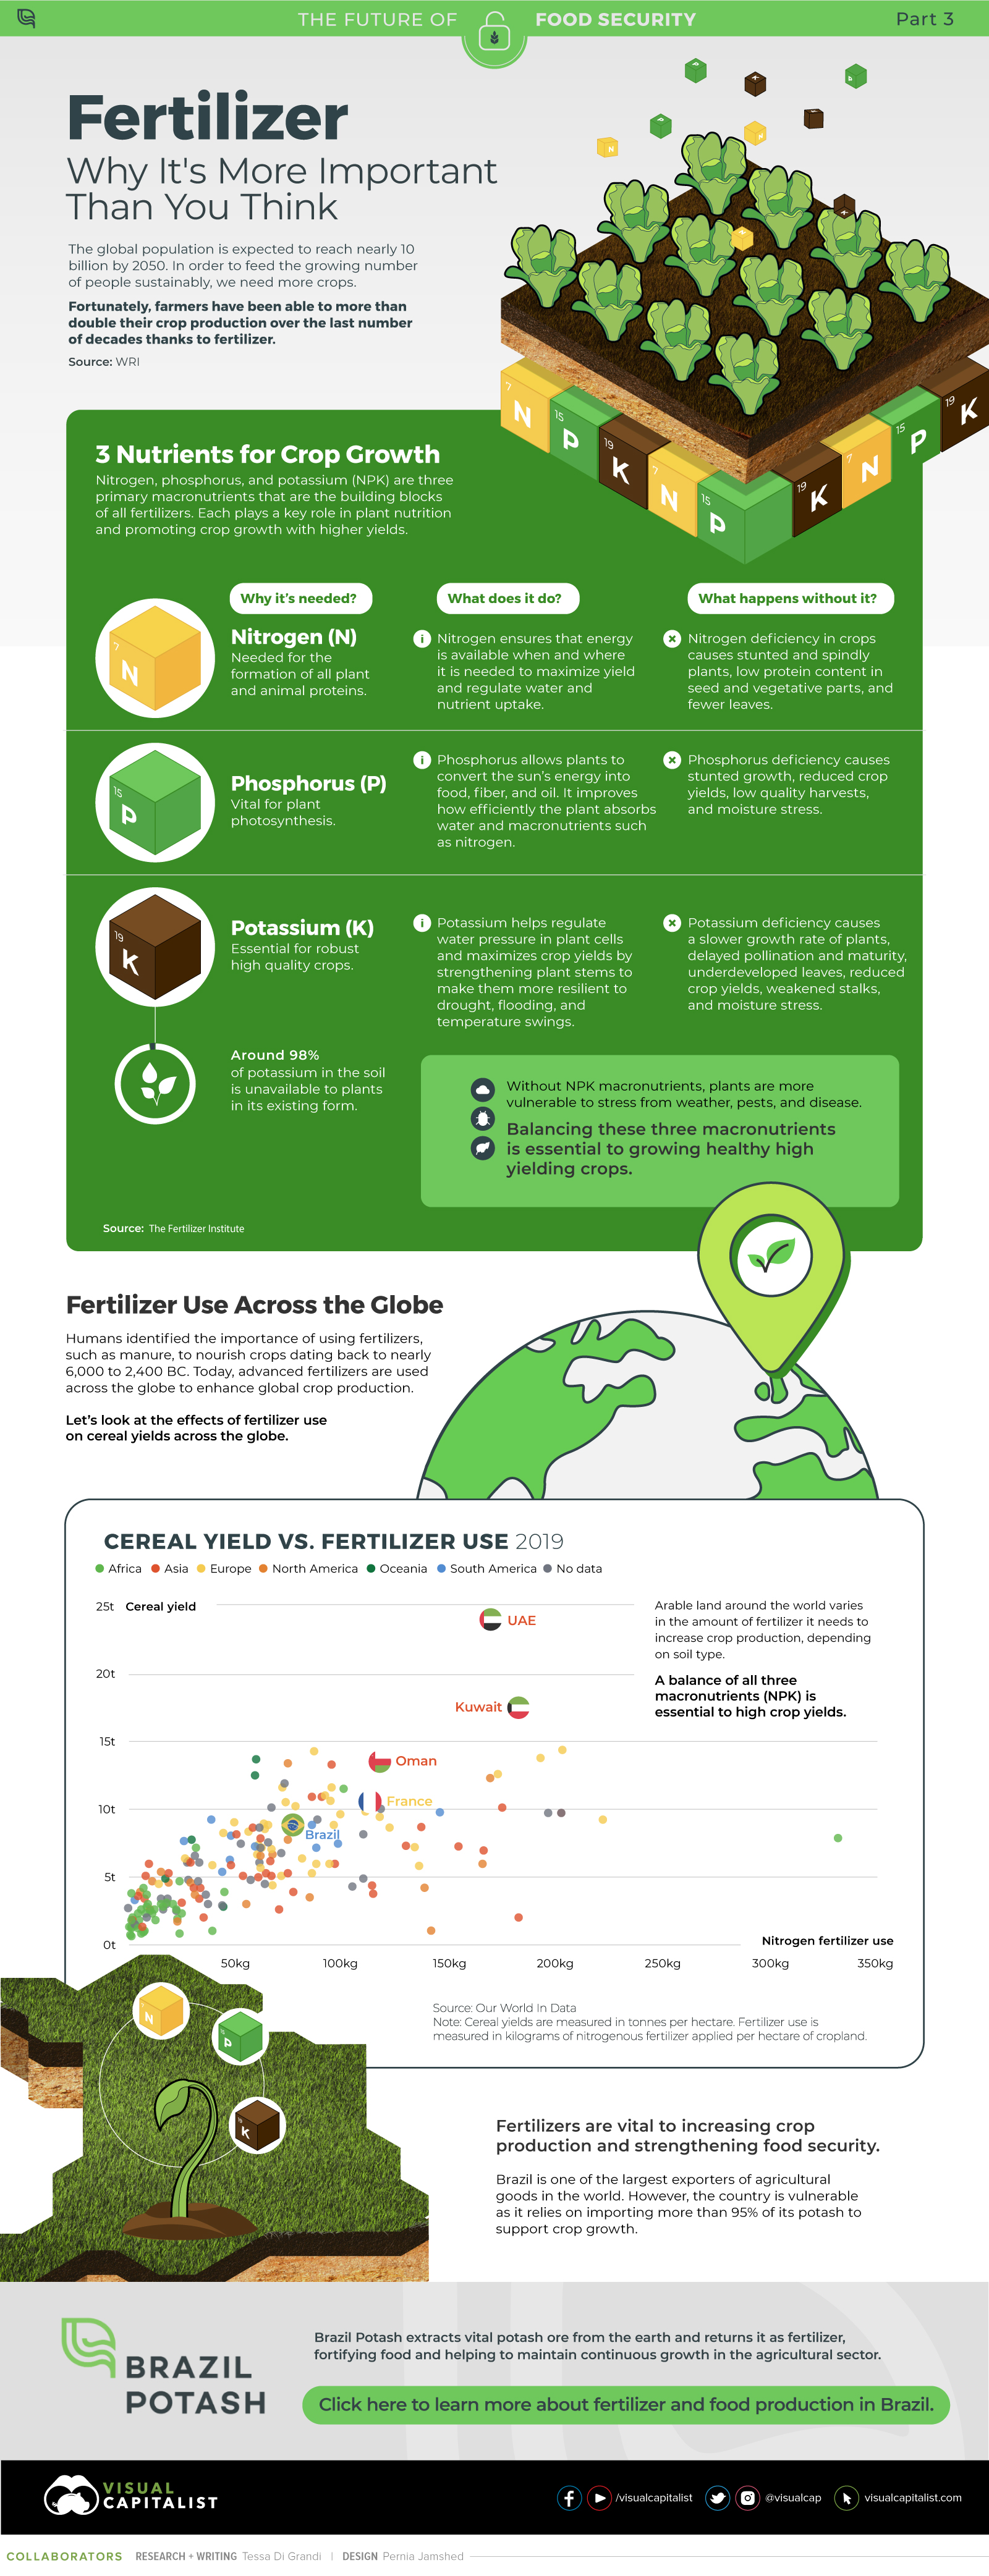
The regions with lower air quality tend to be more landlocked with developing economies, such as some countries in central Africa and Asia, as well as in the Middle East. Finally, while China is lower on this overall list, it’s worth noting that it is one of the most prominent on the cartogram due to its sheer population size. on Over recent decades, farmers have been able to more than double their production of crops thanks to fertilizers and the vital nutrients they contain. When crops are harvested, the essential nutrients are taken away with them to the dining table, resulting in the depletion of these nutrients in the soil. To replenish these nutrients, fertilizers are needed, and the cycle continues. The above infographic by Brazil Potash shows the role that each macronutrient plays in growing healthy, high-yielding crops.
Food for Growth
Nitrogen, phosphorus, and potassium (NPK) are three primary macronutrients that are the building blocks of the global fertilizer industry. Each plays a key role in plant nutrition and promoting crop growth with higher yields. Let’s take a look at how each macronutrient affects plant growth. If crops lack NPK macronutrients, they become vulnerable to various stresses caused by weather conditions, pests, and diseases. Therefore, it is crucial to maintain a balance of all three macronutrients for the production of healthy, high-yielding crops.
The Importance of Fertilizers
Humans identified the importance of using fertilizers, such as manure, to nourish crops dating back to nearly 6,000 to 2,400 BC. As agriculture became more intensive and large-scale, farmers began to experiment with different types of fertilizers. Today advanced chemical fertilizers are used across the globe to enhance global crop production. There are a myriad of factors that affect soil type, and so the farmable land must have a healthy balance of all three macronutrients to support high-yielding, healthy crops. Consequently, arable land around the world varies in the amount and type of fertilizer it needs. Fertilizers play an integral role in strengthening food security, and a supply of locally available fertilizer is needed in supporting global food systems in an ever-growing world. Brazil is one of the largest exporters of agricultural goods in the world. However, the country is vulnerable as it relies on importing more than 95% of its potash to support crop growth. Brazil Potash is developing a new potash project in Brazil to ensure a stable domestic source of this nutrient-rich fertilizer critical for global food security. Click here to learn more about fertilizer and food production in Brazil.