Hedge Fund Rich List: Who Stayed Afloat in Worst Year Since 2008?
Every year, Institutional Investor’s Alpha documents the performance of the world’s most elite investors: hedge fund managers. The Hedge Fund Rich List, in its 14th year of publication, is a “who’s who” of the industry and highlights the performances of the most successful investment managers in the world. Our infographic today is based on this report, and it breaks down the last year for this elite group.
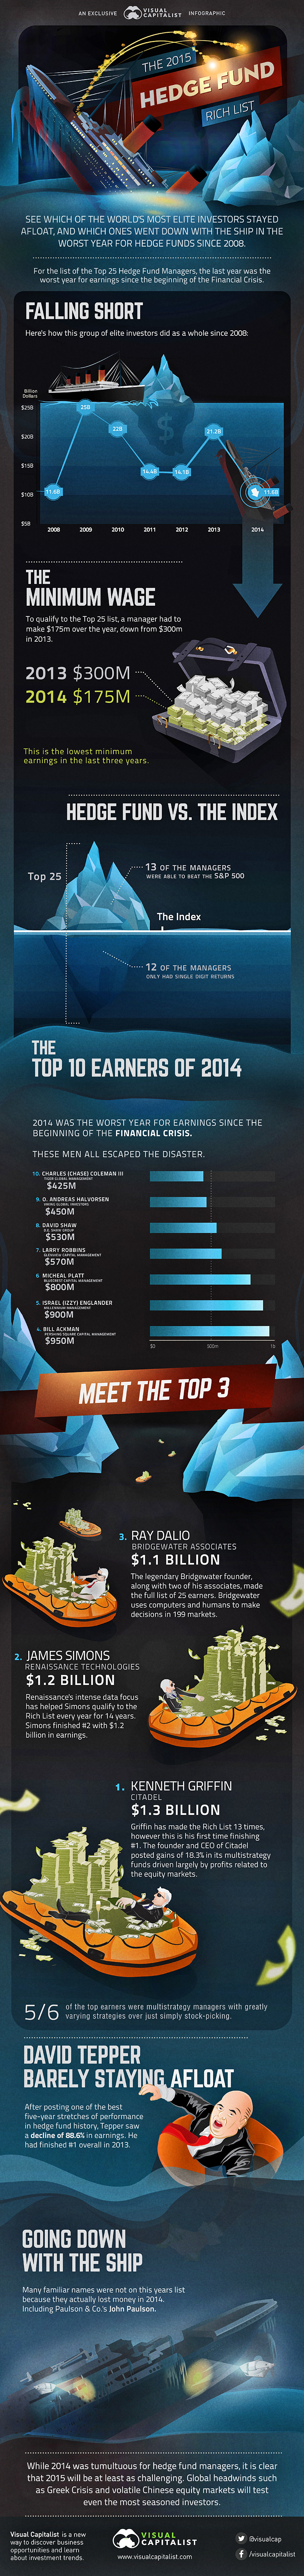
The Worst Year Since the Financial Crisis
The performance of this collective of top-notch investors was the worst as a whole since the Financial Crisis in 2008. In the previous five years, their total earnings averaged $19.3 billion. Last year, the group brought in a paltry $11.6 billion. This brought average earnings per person down to $467 million over the year from $846 million in 2013. This is counterintuitive based on the fact that the S&P 500 gained an impressive 13.7% on the year in 2014. Interestingly, only about half of the managers beat the index’s performance, with the rest falling into single-digit return territory.
Minimum Wage
The minimum amount of earnings to make the list dropped significantly from $300 million to $175 million. This is the lowest minimum earnings in the last three years. David Tepper, of Appaloosa Management, is barely staying afloat. After having one of the best five-year stretches of performance in hedge fund history, he saw his earnings decline 88.6% in 2014. He had finished #1 overall in 2013, but only saw a 2.2% gain over the last year. Many managers were not even lucky enough to get the “minimum wage”. John Paulson of Paulson & Co., who famously made his fortune betting against the US Housing Market in 2007, ended up tanking in 2014 with his second worst year ever. His Advantage Plus fund fell 36% while his Advantage fund dropped 29%.
The Top 10 Investors
The managers that had the highest returns were as follows: 10. Charles (Chase) Coleman III of Tiger Global Management – $425 million 9. O. Andreas Halvorsen of Viking Global Investors – $450 million 8. David Shaw of D.E. Shaw Group – $530 million 7. Larry Robbins of Glenview Capital Management – $570 million 6. Michael Platt of BlueCrest Capital Management – $800 million 5. Israel (Izzy) Englander of Millennium Management – $900 million 4. Bill Ackman of Pershing Square Capital Management – $950 million 3. Ray Dalio of Bridgewater Associates – $1.1 billion 2. James Simons of Renaissance Technologies – $1.2 billion 1. Kenneth Griffin of Citadel – $1.3 billion Profiles on those that broke $1 billion: Ray Dalio, the legendary founder of Bridgewater Associates, along with two of his associates, made the full list of 25 earners. Bridgewater uses computers and humans to make decisions in 199 markets. Ray took home $1.1 billion. Renaissance’s intense data focus helped James Simons qualify to the Rich List every year for the last 14 years. He finished #2 with $1.2 billion in earnings. Kenneth Griffin has made the Rich List 13 times, however this is his first time finishing #1 overall. The founder and CEO of Citadel posted gains of 18.3% in its multistrategy funds driven largely by profits related to the equity markets.
What’s Ahead for 2015?
While 2014 was a tumultuous year for hedge fund managers, it is clear 2015 will be at least as challenging and interesting. Global headwinds such as the Greek Crisis and volatile Chinese equity markets will test even the most seasoned investors.
on Last year, stock and bond returns tumbled after the Federal Reserve hiked interest rates at the fastest speed in 40 years. It was the first time in decades that both asset classes posted negative annual investment returns in tandem. Over four decades, this has happened 2.4% of the time across any 12-month rolling period. To look at how various stock and bond asset allocations have performed over history—and their broader correlations—the above graphic charts their best, worst, and average returns, using data from Vanguard.
How Has Asset Allocation Impacted Returns?
Based on data between 1926 and 2019, the table below looks at the spectrum of market returns of different asset allocations:
We can see that a portfolio made entirely of stocks returned 10.3% on average, the highest across all asset allocations. Of course, this came with wider return variance, hitting an annual low of -43% and a high of 54%.
A traditional 60/40 portfolio—which has lost its luster in recent years as low interest rates have led to lower bond returns—saw an average historical return of 8.8%. As interest rates have climbed in recent years, this may widen its appeal once again as bond returns may rise.
Meanwhile, a 100% bond portfolio averaged 5.3% in annual returns over the period. Bonds typically serve as a hedge against portfolio losses thanks to their typically negative historical correlation to stocks.
A Closer Look at Historical Correlations
To understand how 2022 was an outlier in terms of asset correlations we can look at the graphic below:
The last time stocks and bonds moved together in a negative direction was in 1969. At the time, inflation was accelerating and the Fed was hiking interest rates to cool rising costs. In fact, historically, when inflation surges, stocks and bonds have often moved in similar directions. Underscoring this divergence is real interest rate volatility. When real interest rates are a driving force in the market, as we have seen in the last year, it hurts both stock and bond returns. This is because higher interest rates can reduce the future cash flows of these investments. Adding another layer is the level of risk appetite among investors. When the economic outlook is uncertain and interest rate volatility is high, investors are more likely to take risk off their portfolios and demand higher returns for taking on higher risk. This can push down equity and bond prices. On the other hand, if the economic outlook is positive, investors may be willing to take on more risk, in turn potentially boosting equity prices.
Current Investment Returns in Context
Today, financial markets are seeing sharp swings as the ripple effects of higher interest rates are sinking in. For investors, historical data provides insight on long-term asset allocation trends. Over the last century, cycles of high interest rates have come and gone. Both equity and bond investment returns have been resilient for investors who stay the course.