The two are very much intertwined, however. By the end of 2020, authorities estimate that upwards of 265 million people could be on the brink of starvation globally, almost double the current rate of crisis-level food insecurity. Today’s visualizations use data from the fourth annual Global Report on Food Crises (GRFC 2020) to demonstrate the growing scale of the current situation, as well as its intense concentration in just 55 countries around the globe.
Global Overview
The report looks at the prevalence of acute food insecurity, which has severe impacts on lives, livelihoods, or both. How does the Integrated Food Security Phase Classification (IPC) classify the different phases of acute food insecurity?
Phase 1: Minimal/None Phase 2: Stressed Phase 3: Crisis Phase 4: Emergency Phase 5: Catastrophe/Famine
According to the IPC, urgent action must be taken to mitigate these effects from Phase 3 onwards. Already, 135 million people experience critical food insecurity (Phase 3 or higher). Here’s how that breaks down by country: Source: GRFC 2020, Table 5 – Peak numbers of acutely food-insecure people in countries with food crises, 2019 ¹ Include populations classified in Emergency (IPC/CH Phase 4) ² Include populations classified in Emergency (IPC/CH Phase 4) and in Catastrophe (IPC/CH Phase 5) While starvation is a pressing global issue even at the best of times, the ongoing impact of the COVID-19 pandemic is projected to almost double these numbers by an additional 130 million people—a total of 265 million by the end of 2020. To put that into perspective, that’s roughly equal to the population of every city and town in the United States combined.
A Continent in Crisis
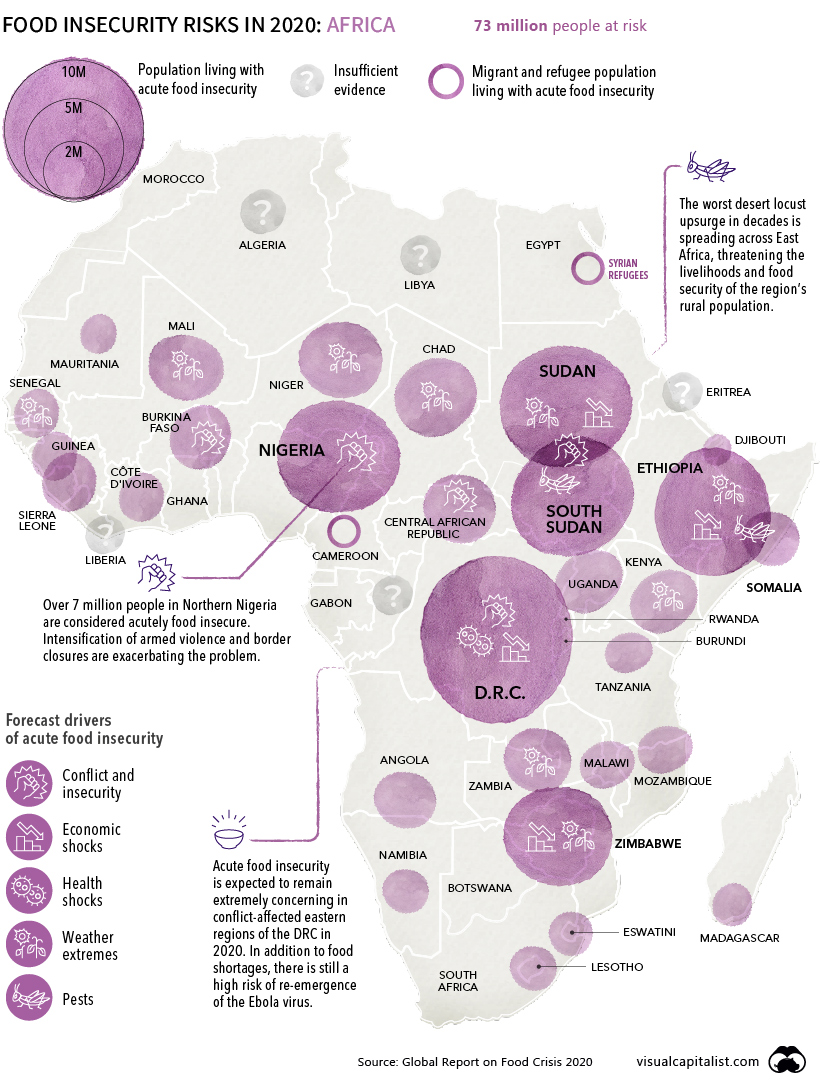
Food insecurity impacts populations around the world, but Africa faces bigger hurdles than any other continent. The below map provides a deeper dive:
Over half of populations analyzed by the report – 73 million people – are found in Sub-Saharan Africa. Main drivers of acute food insecurity found all over the continent include:
Conflict/Insecurity Examples: Interstate conflicts, internal violence, regional/global instability, or political crises. In many instances, these result in people being displaced as refugees. Weather extremes Examples: Droughts and floods Economic shocks Macroeconomic examples: Hyperinflation and currency depreciation Microeconomic examples: Rising food prices, reduced purchasing power Pests Examples: Desert locusts, armyworms Health shocks Examples: Disease outbreaks, which can be worsened by poor quality of water, sanitation, or air Displacement A major side-effect of conflict, food insecurity, and weather shocks.
One severely impacted country is the Democratic Republic of Congo, where over 15 million people are experiencing acute food insecurity. DRC’s eastern region is experiencing intense armed conflict, and as of March 2020, the country is also at high risk of Ebola re-emergence. Meanwhile, in Eastern Africa, a new generation of locusts has descended on croplands, wiping out vital food supplies for millions of people. Weather conditions have pushed this growing swarm of trillions of locusts into countries that aren’t normally accustomed to dealing with the pest. Swarms have the potential to grow exponentially in just a few months, so this could continue to cause big problems in the region in 2020.
Insecurity in Middle East and Asia
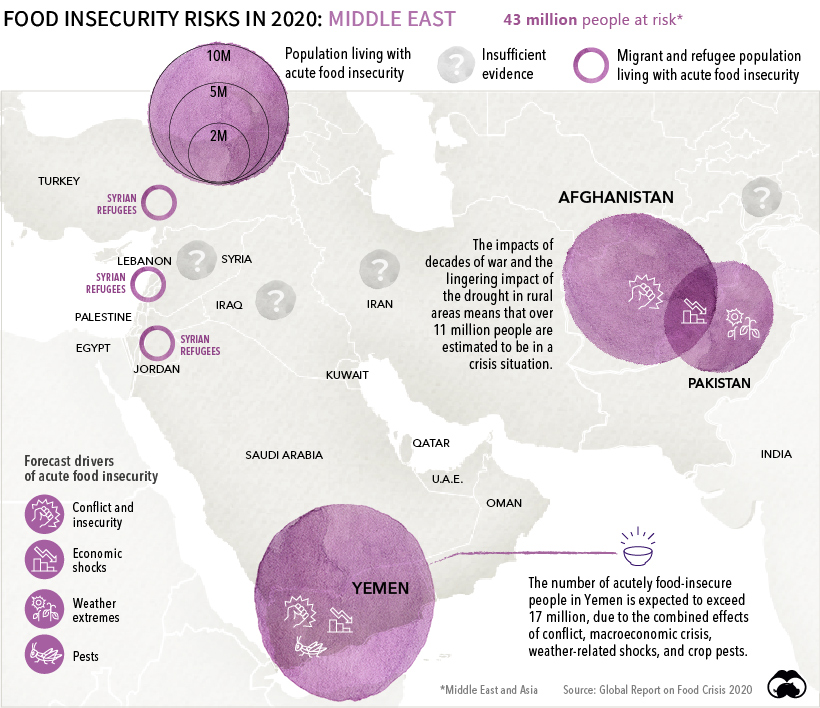
In the Middle East, 43 million more people are dealing with similar challenges. Yemen is the most food-insecure country in the world, with 15.9 million (53% of its analyzed population) in crisis. It’s also the only area where food insecurity is at a Catastrophe (IPC/CH Phase 5) level, a result of almost three years of civil war.
Another troubled spot in the Middle East is Afghanistan, where 11.3 million people find themselves in a critical state of acute food insecurity. Over 138,000 refugees returned to the country from Iran and Pakistan between January-March 2020, putting a strain on food resources. Over half (51%) of the analyzed population of Pakistan also faces acute food insecurity, the highest in all of Asia. These numbers have been worsened by extreme weather conditions such as below-average monsoon rains.
An Incomplete Analysis
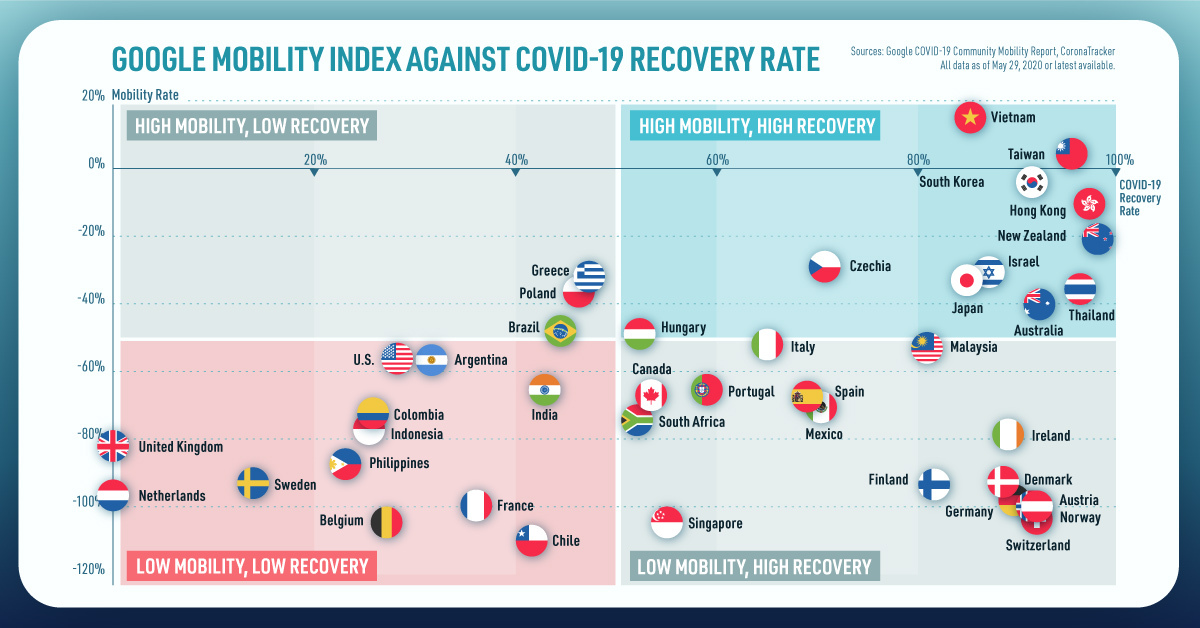
As COVID-19 deteriorates economic conditions, it could also result in funding cuts to major humanitarian organizations. Upwards of 300,000 people could die every day if this happens, according to the World Food Program’s executive director. The GRFC report also warns that these projections are still inadequate, due to major data gaps and ongoing challenges. 16 countries, such as Iran or the Philippines have not been included in the analysis due to insufficient data available. More work needs to be done to understand the true severity of global food insecurity, but what is clear is that an ongoing pandemic will not do these regions any favors. By the time the dust settles, the food insecurity problem could be compounded significantly. on Today’s chart measures the extent to which 41 major economies are reopening, by plotting two metrics for each country: the mobility rate and the COVID-19 recovery rate: Data for the first measure comes from Google’s COVID-19 Community Mobility Reports, which relies on aggregated, anonymous location history data from individuals. Note that China does not show up in the graphic as the government bans Google services. COVID-19 recovery rates rely on values from CoronaTracker, using aggregated information from multiple global and governmental databases such as WHO and CDC.
Reopening Economies, One Step at a Time
In general, the higher the mobility rate, the more economic activity this signifies. In most cases, mobility rate also correlates with a higher rate of recovered people in the population. Here’s how these countries fare based on the above metrics. Mobility data as of May 21, 2020 (Latest available). COVID-19 case data as of May 29, 2020. In the main scatterplot visualization, we’ve taken things a step further, assigning these countries into four distinct quadrants:
1. High Mobility, High Recovery
High recovery rates are resulting in lifted restrictions for countries in this quadrant, and people are steadily returning to work. New Zealand has earned praise for its early and effective pandemic response, allowing it to curtail the total number of cases. This has resulted in a 98% recovery rate, the highest of all countries. After almost 50 days of lockdown, the government is recommending a flexible four-day work week to boost the economy back up.
2. High Mobility, Low Recovery
Despite low COVID-19 related recoveries, mobility rates of countries in this quadrant remain higher than average. Some countries have loosened lockdown measures, while others did not have strict measures in place to begin with. Brazil is an interesting case study to consider here. After deferring lockdown decisions to state and local levels, the country is now averaging the highest number of daily cases out of any country. On May 28th, for example, the country had 24,151 new cases and 1,067 new deaths.
3. Low Mobility, High Recovery
Countries in this quadrant are playing it safe, and holding off on reopening their economies until the population has fully recovered. Italy, the once-epicenter for the crisis in Europe is understandably wary of cases rising back up to critical levels. As a result, it has opted to keep its activity to a minimum to try and boost the 65% recovery rate, even as it slowly emerges from over 10 weeks of lockdown.
4. Low Mobility, Low Recovery
Last but not least, people in these countries are cautiously remaining indoors as their governments continue to work on crisis response. With a low 0.05% recovery rate, the United Kingdom has no immediate plans to reopen. A two-week lag time in reporting discharged patients from NHS services may also be contributing to this low number. Although new cases are leveling off, the country has the highest coronavirus-caused death toll across Europe. The U.S. also sits in this quadrant with over 1.7 million cases and counting. Recently, some states have opted to ease restrictions on social and business activity, which could potentially result in case numbers climbing back up. Over in Sweden, a controversial herd immunity strategy meant that the country continued business as usual amid the rest of Europe’s heightened regulations. Sweden’s COVID-19 recovery rate sits at only 13.9%, and the country’s -93% mobility rate implies that people have been taking their own precautions.
COVID-19’s Impact on the Future
It’s important to note that a “second wave” of new cases could upend plans to reopen economies. As countries reckon with these competing risks of health and economic activity, there is no clear answer around the right path to take. COVID-19 is a catalyst for an entirely different future, but interestingly, it’s one that has been in the works for a while. —Carmen Reinhart, incoming Chief Economist for the World Bank Will there be any chance of returning to “normal” as we know it?
