Volatility is a double-edged sword, particularly when it comes to commodity investing. During the good times, it can create skyrocketing returns. But during bad times, it can turn ugly. Today’s infographic comes to us from Prospector Portal, and shows how investing in precious metals equities can outperform or underperform the broader metals market.
Capitalizing on Volatility: Timing Matters
Just like most investments, timing matters with commodities. Due to the complex production processes of commodities, unexpected demand shocks are met with slower supply responses. This, along with other factors, creates commodity supercycles—extended periods of upswings and downswings in prices. Investors must time their investments to take advantage of this volatility, and there are multiple ways to do so.
Three Ways to Invest in Commodities
There are three primary routes investors can take when it comes to investing in commodities. Among these, commodity-related equities offer by far the most leverage to changes in prices. Let’s dive into how investors can use this leverage to their advantage with volatile metal prices.
The Fundamentals of Investing in Mining Equities
When it comes to commodity investing, targeting miners and mineral exploration companies presents fundamental benefits and drawbacks. As metal prices rise, the performance of mining companies improves in several ways—while in deteriorating conditions, they do the opposite: With the right timing, these ups and downs can create explosive opportunities. Mining companies, especially explorers, use these price swings to their advantage and often produce market-beating returns during an upswing. But how?
The Proof: How Mining Equities React to Metal Prices
Not only do price increases translate into higher profits for mining companies, but they can also change the outlook and value of exploration companies. As a result, investing in exploration companies can be a great way to gain exposure to changing prices. That said, these types of companies can generate greater equity returns over a shorter period of time when prices are high, but they can also turn dramatically negative when prices are low. Below, we compare how producers and exploration companies with a NI-43-101 compliant resource perform during bull and bear markets for precious metals. All figures are in U.S. dollars unless otherwise stated. During the bear market period, the price of gold declined by 2.66%, and despite engaging in exploration activity, most companies saw a slump in their share prices. In particular, exploration companies, or juniors, took a heavier hit, with returns averaging -31.66%. But even during a bear market, a discovery can make all the difference—as was the case for producer Wesdome Gold Mines, generating a 109.95% return over 2018.
Average returns for gold producers including Wesdome: 24.83% Average returns for gold producers excluding Wesdome: -17.65%
During the bull market period for gold, gold mining companies outperformed the price of gold, with juniors offering the highest equity returns averaging 153.43%. Gold producers outperformed the commodity market, the value of their equities increased 69.61%—less than half of that of exploration companies.
Silver: Bears vs Bulls
Similar to gold mining companies, performances of silver producers and explorers reflected the volatility in silver prices: During the bear market period for silver, its price decreased by 9.8%. Explorers and producers both saw a dip in their share prices, with the equity of silver producers decreasing by 21.63%. However, the discovery of a high-quality silver deposit again made the difference for SilverCrest Metals, which generated a 116.85% return over the year.
Average returns for silver exploration companies including SilverCrest: 8.32% Average returns for silver exploration companies excluding SilverCrest: -27.86%
On the other hand, during the bull market period, the price of silver increased by 34.33%. Silver exploration companies surpassed the performance of the price of silver.
Average returns for silver producers: 69.04% Average returns for silver exploration companies: 95.36%
The potential to generate massive returns and losses is evident in both cases for gold and silver.
The Investment Potential of Exploration
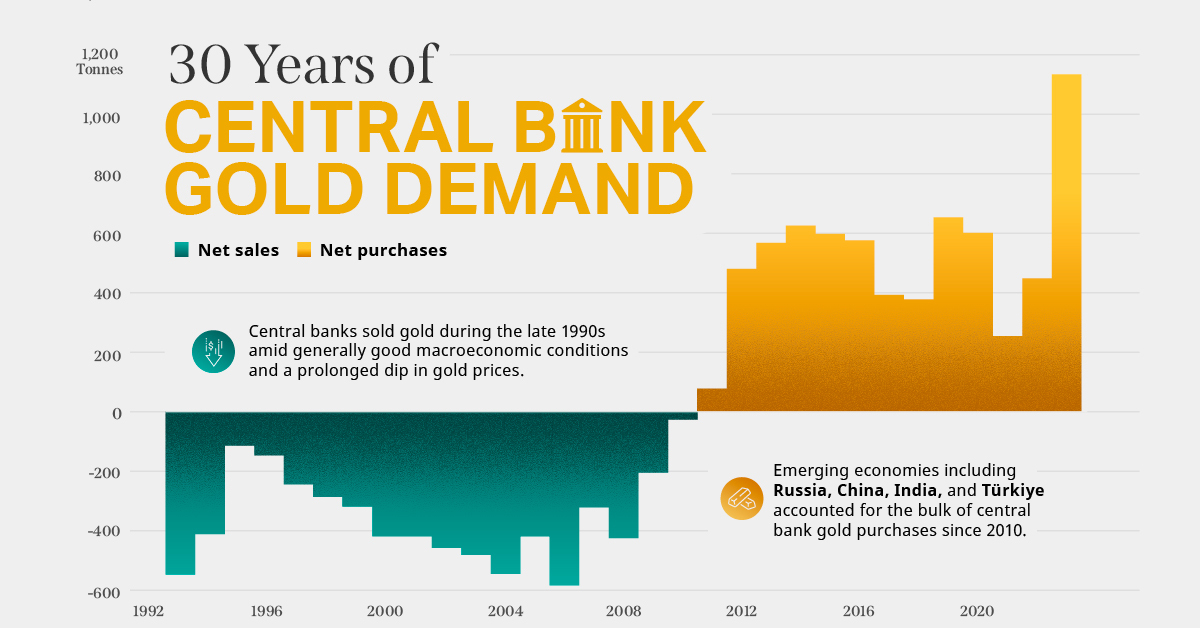
Mining equities tend to outperform underlying commodity prices during bull markets, while underperforming during bear markets. For mining exploration companies, these effects are even more pronounced—exploration companies are high-risk but can offer high-reward when it comes to commodity investing. To reap the rewards of volatile returns, you have to know the risks and catch the market at the right time. on Did you know that nearly one-fifth of all the gold ever mined is held by central banks? Besides investors and jewelry consumers, central banks are a major source of gold demand. In fact, in 2022, central banks snapped up gold at the fastest pace since 1967. However, the record gold purchases of 2022 are in stark contrast to the 1990s and early 2000s, when central banks were net sellers of gold. The above infographic uses data from the World Gold Council to show 30 years of central bank gold demand, highlighting how official attitudes toward gold have changed in the last 30 years.
Why Do Central Banks Buy Gold?
Gold plays an important role in the financial reserves of numerous nations. Here are three of the reasons why central banks hold gold:
Balancing foreign exchange reserves Central banks have long held gold as part of their reserves to manage risk from currency holdings and to promote stability during economic turmoil. Hedging against fiat currencies Gold offers a hedge against the eroding purchasing power of currencies (mainly the U.S. dollar) due to inflation. Diversifying portfolios Gold has an inverse correlation with the U.S. dollar. When the dollar falls in value, gold prices tend to rise, protecting central banks from volatility. The Switch from Selling to Buying In the 1990s and early 2000s, central banks were net sellers of gold. There were several reasons behind the selling, including good macroeconomic conditions and a downward trend in gold prices. Due to strong economic growth, gold’s safe-haven properties were less valuable, and low returns made it unattractive as an investment. Central bank attitudes toward gold started changing following the 1997 Asian financial crisis and then later, the 2007–08 financial crisis. Since 2010, central banks have been net buyers of gold on an annual basis. Here’s a look at the 10 largest official buyers of gold from the end of 1999 to end of 2021: Rank CountryAmount of Gold Bought (tonnes)% of All Buying #1🇷🇺 Russia 1,88828% #2🇨🇳 China 1,55223% #3🇹🇷 Türkiye 5418% #4🇮🇳 India 3956% #5🇰🇿 Kazakhstan 3455% #6🇺🇿 Uzbekistan 3115% #7🇸🇦 Saudi Arabia 1803% #8🇹🇭 Thailand 1682% #9🇵🇱 Poland1282% #10🇲🇽 Mexico 1152% Total5,62384% Source: IMF The top 10 official buyers of gold between end-1999 and end-2021 represent 84% of all the gold bought by central banks during this period. Russia and China—arguably the United States’ top geopolitical rivals—have been the largest gold buyers over the last two decades. Russia, in particular, accelerated its gold purchases after being hit by Western sanctions following its annexation of Crimea in 2014. Interestingly, the majority of nations on the above list are emerging economies. These countries have likely been stockpiling gold to hedge against financial and geopolitical risks affecting currencies, primarily the U.S. dollar. Meanwhile, European nations including Switzerland, France, Netherlands, and the UK were the largest sellers of gold between 1999 and 2021, under the Central Bank Gold Agreement (CBGA) framework. Which Central Banks Bought Gold in 2022? In 2022, central banks bought a record 1,136 tonnes of gold, worth around $70 billion. Country2022 Gold Purchases (tonnes)% of Total 🇹🇷 Türkiye14813% 🇨🇳 China 625% 🇪🇬 Egypt 474% 🇶🇦 Qatar333% 🇮🇶 Iraq 343% 🇮🇳 India 333% 🇦🇪 UAE 252% 🇰🇬 Kyrgyzstan 61% 🇹🇯 Tajikistan 40.4% 🇪🇨 Ecuador 30.3% 🌍 Unreported 74165% Total1,136100% Türkiye, experiencing 86% year-over-year inflation as of October 2022, was the largest buyer, adding 148 tonnes to its reserves. China continued its gold-buying spree with 62 tonnes added in the months of November and December, amid rising geopolitical tensions with the United States. Overall, emerging markets continued the trend that started in the 2000s, accounting for the bulk of gold purchases. Meanwhile, a significant two-thirds, or 741 tonnes of official gold purchases were unreported in 2022. According to analysts, unreported gold purchases are likely to have come from countries like China and Russia, who are looking to de-dollarize global trade to circumvent Western sanctions.
There were several reasons behind the selling, including good macroeconomic conditions and a downward trend in gold prices. Due to strong economic growth, gold’s safe-haven properties were less valuable, and low returns made it unattractive as an investment.
Central bank attitudes toward gold started changing following the 1997 Asian financial crisis and then later, the 2007–08 financial crisis. Since 2010, central banks have been net buyers of gold on an annual basis.
Here’s a look at the 10 largest official buyers of gold from the end of 1999 to end of 2021:
Source: IMF
The top 10 official buyers of gold between end-1999 and end-2021 represent 84% of all the gold bought by central banks during this period.
Russia and China—arguably the United States’ top geopolitical rivals—have been the largest gold buyers over the last two decades. Russia, in particular, accelerated its gold purchases after being hit by Western sanctions following its annexation of Crimea in 2014.
Interestingly, the majority of nations on the above list are emerging economies. These countries have likely been stockpiling gold to hedge against financial and geopolitical risks affecting currencies, primarily the U.S. dollar.
Meanwhile, European nations including Switzerland, France, Netherlands, and the UK were the largest sellers of gold between 1999 and 2021, under the Central Bank Gold Agreement (CBGA) framework.
Which Central Banks Bought Gold in 2022?
In 2022, central banks bought a record 1,136 tonnes of gold, worth around $70 billion. Türkiye, experiencing 86% year-over-year inflation as of October 2022, was the largest buyer, adding 148 tonnes to its reserves. China continued its gold-buying spree with 62 tonnes added in the months of November and December, amid rising geopolitical tensions with the United States. Overall, emerging markets continued the trend that started in the 2000s, accounting for the bulk of gold purchases. Meanwhile, a significant two-thirds, or 741 tonnes of official gold purchases were unreported in 2022. According to analysts, unreported gold purchases are likely to have come from countries like China and Russia, who are looking to de-dollarize global trade to circumvent Western sanctions.